This Prime Day, while many consumers were scouring the internet for the best deals they could find, we at Namogoo were watching to see how the sale days would impact eCommerce retailers besides Amazon. We were especially interested to see how this year’s sales event would play out in light of clear signs that it would be different than in years past.
For starters, this Prime Day was longer than in previous years – 48 hours on July 15 and 16, as compared to 36 hours last year and 30 in 2017. There was also speculation about how protests targeting Amazon would impact the retail giant. And it was clear that its rivals were also gearing up for tough competition, as some 250 retailers launched their own sales to compete with Prime Day – with eBay even naming its event “Crash Sale” in reference to technical difficulties that marred the beginning of Prime Day 2018.
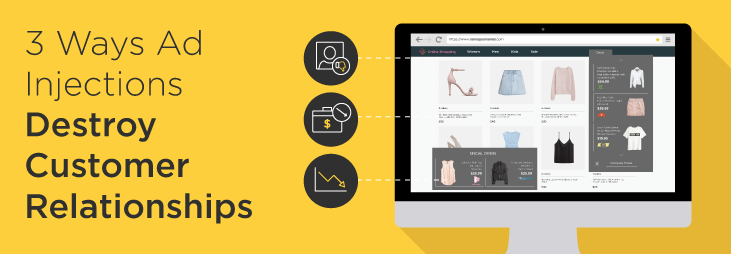
While we were curious to know how these factors would impact the sales numbers for the retailers beyond Amazon, we also wanted to see how Prime Day would affect the frequency of Customer Journey Hijacking (CJH) – a phenomenon in which malware running on a shopper’s computer causes ads to appear when the shopper visits an eCommerce website.
To gauge Prime Day’s impact on online retailers, we turned to our data team for insights. Namogoo analyzes over 500 million website page views per day across a variety of top retail sites, so we decided to zoom in on 12 different verticals and examined each vertical’s conversion rates and infection rates (the percentage of users whose devices are infected with ad-injecting malware) for every day from June 15 through July 20. The verticals we examined are:
- Apparel
- Electronics
- Fashion
- Footwear
- Gifts/hobbies
- Health/beauty
- Home
- Insurance
- Lifestyle
- Marketplaces
- Office supplies
- Supermarkets
The numbers we gathered showed major differences in the ways Prime Day impacted retailers in these various verticals, both in terms of their conversion rates and in terms of their shoppers’ CJH infection rates. While it was a Prime Day to remember for many retailers, in certain industries it was simply business as usual.
How did Prime Day impact conversion rates for online retailers?
In general, the biggest winners according to our numbers were the apparel, electronics, and gifts/hobbies verticals, followed by office supplies, lifestyle, fashion, and footwear.
For apparel retailers, July 15 – the beginning of Prime Day – saw a remarkable jump in conversion rates among both desktop and mobile shoppers. Whereas the average daily conversion rates between June 15 and July 14 had been 4.03% on desktop and 1.99% on mobile, on July 15 those rates leapt to 5.72% on desktop and 2.90% on mobile. Notably, those rates were higher than on any single day in the previous month (a month that had included the Fourth of July holiday in the U.S.).
Retailers in the gifts/hobbies vertical saw similar increases in their conversion rates for both desktop and mobile users. Whereas the previous month had seen a daily average conversion rate of 3.39% on desktop, that number jumped to 4.01% on July 15 and 4.20% on July 16. We saw the same pattern among shoppers on mobile: Whereas the daily average had been 1.42% in the previous month, it reached 1.91% on July 15 and 2.01% on July 16.
For electronics retailers, Prime Day and the several days preceding it and following it saw both mobile and desktop shoppers convert at significantly higher rates than throughout the previous month. However, the timing of those increases was not perfectly aligned with Prime Day. The highest single-day desktop conversion rate we saw was actually the day before Prime Day – 0.52% on July 14, more than double the daily average conversion rate of 0.24% that we had seen since June 15. On mobile devices, however, the highest conversion rate was recorded on July 16 – 0.45%, as compared to a daily average rate of 0.20% in the month before Prime Day.
Prime Day also brought above-average conversion rates for both lifestyle and office supply retailers. Lifestyle companies saw desktop conversion rates of 1.47% on July 15 and 1.92% on July 16, as compared to a daily average of 1.28% in the previous month. Their mobile conversion rates were somewhat lower but still increased during Prime Day: 0.83% on July 15 and 1.07% on July 16, as compared to a daily average rate of 0.78% in the previous month. Meanwhile, the office supply retailers achieved desktop conversion rates of 11.07% on July 15 and 11.54% on July 16, as compared to a daily average rate of 8.52% during the previous month. And their mobile conversion rates were 2.40% on July 15 and 2.35% on July 16, as compared to a daily average of 1.80% during the previous month.
Retailers in both the fashion and footwear verticals saw their conversion rates on July 15 and 16 exceed the daily averages of the previous month, but here the increases were less significant. In the case of the fashion retailers, the rates that were seen during Prime Day paled in comparison to the achievements of the July 4 holiday.
In contrast to some of these verticals, the online marketplaces saw minor increases in their conversion rates on Prime Day. Meanwhile, retailers in the health/beauty, home, insurance, and supermarket verticals actually had conversion rates on at least one of the two days of Prime Day that were below their daily average rates from the previous month on desktop, mobile, or both.
How did this impact Customer Journey Hijacking infection rates?
In most cases, Namogoo’s numbers showed that as conversion rates increased on and around Prime Day, so did the frequency with which shoppers were targeted with injected ads.
Just like companies selling apparel online saw their highest daily conversion rates on July 15, this day also brought their visitors’ highest infection rates: 21.86% on desktop and 15.92% on mobile, as compared to daily average infection rates of 18.53% on desktop and 13.83% on mobile during the previous month.
And like electronics retailers saw their conversion rate among desktop users jump the day before Prime Day, this vertical’s infection rates among both desktop and mobile users peaked on the same day. While desktop users’ infection rate reached 18.08% on July 14 (as compared to a daily average rate of 15.77% between June 15 and July 14), mobile users’ infection rate reached 16.93% (as compared to a daily average rate of 13.03% over the course of that month). However, while conversion rates for these retailers remained high in the days following Prime Day, their users’ infection rates dropped sharply, reaching just 10.11% on desktop and 9.88% on mobile on July 18.
The gifts/hobbies vertical saw similar jumps in infection rates during Prime Day, but here the heightened frequency of injected ads also continued for several days afterward. For desktop users, the rate jumped from 25.48% on July 14 to 30.77% on July 15 and then remained above 30% until July 20. Among mobile users, the rate also jumped on July 15, reaching 22.67%, as compared to a daily average rate of 16.97% over the previous month – and then it continued climbing, peaking at 26.47% on July 18.
However, not all verticals saw major increases in their infection rates during Prime Day. For example, although retailers in the lifestyle vertical enjoyed conversion rates well above the average daily rates of the previous month, these companies saw only minor increases in their infection rates. The footwear and home verticals also saw slight increases in their users’ infection rates on both desktop and mobile.
Interestingly, although office supply companies enjoyed a considerable jump in their conversion rates during Prime Day, their mobile visitors’ infection rates were slightly below the daily average rate of the previous month (12.83% on July 15 and 12.81% on July 16, as compared to a daily average of 13.48% between June 15 and July 14). However, the infection rates among desktop users on Prime Day slightly exceeded the daily average rates of the previous month (18.21% on July 15 and 18.57% on July 16, as compared to 17.80% between June 15 and July 14).
What do these numbers tell us about Prime Day’s impact on retailers?
Most of all, these numbers show us that Prime Day’s impact was felt differently among the various types of online retailers. Some verticals saw major jumps in their conversion rates, while others saw minor increases or even rates that were below the daily average of the previous month.
As for infection rates, much of what we can learn from these numbers is consistent with a pattern we frequently see among retailers: The shoppers most likely to make a purchase are also most likely to wind up with ad-injecting malware on their digital devices. As a result, when conversion rates go up, so do infection rates.
Notably, however, these numbers do not address the question of how a retailer’s conversion rate and sales numbers are affected when injected ads are blocked among visitors to its online store. That is a question better answered by our customer case studies.
How does Customer Journey Hijacking impact your sales? To see what injected ads are doing in your online store, you can get a free website analysis


