


As the dust from the initial holiday shopping frenzy settles, industry reports point to record-breaking figures for both the 2018 Black Friday and Cyber Monday shopping events.
For online retailers and eCommerce businesses, data from this period provides valuable insights on customer trends and lessons learned to improve their digital campaigns going forward.
To help uncover consumer behavior insights relevant to online businesses, Namogoo’s data team analyzed over one billion web sessions across top verticals and took a deep dive into our Black Friday and Cyber Monday stats, as well as examined how these two days compared to each other.
Without further ado, here’s our Black Friday and Cyber Monday report for 2018:
Black Friday 2018 Traffic & Conversions More than Live Up to the Hype
We compared key metrics for Black Friday to the preceding six Fridays (from October 12 to November 16) across verticals worldwide. Compared to the previous six Fridays:
- Traffic skyrocketed on Black Friday by 124.5%
- Conversion rates almost doubled at an increase of 94.7%
- Overall orders on Black Friday more than quadrupled, increasing by 342%
Black Friday Vs. Cyber Monday: Which Day Was eCommerce King in 2018?
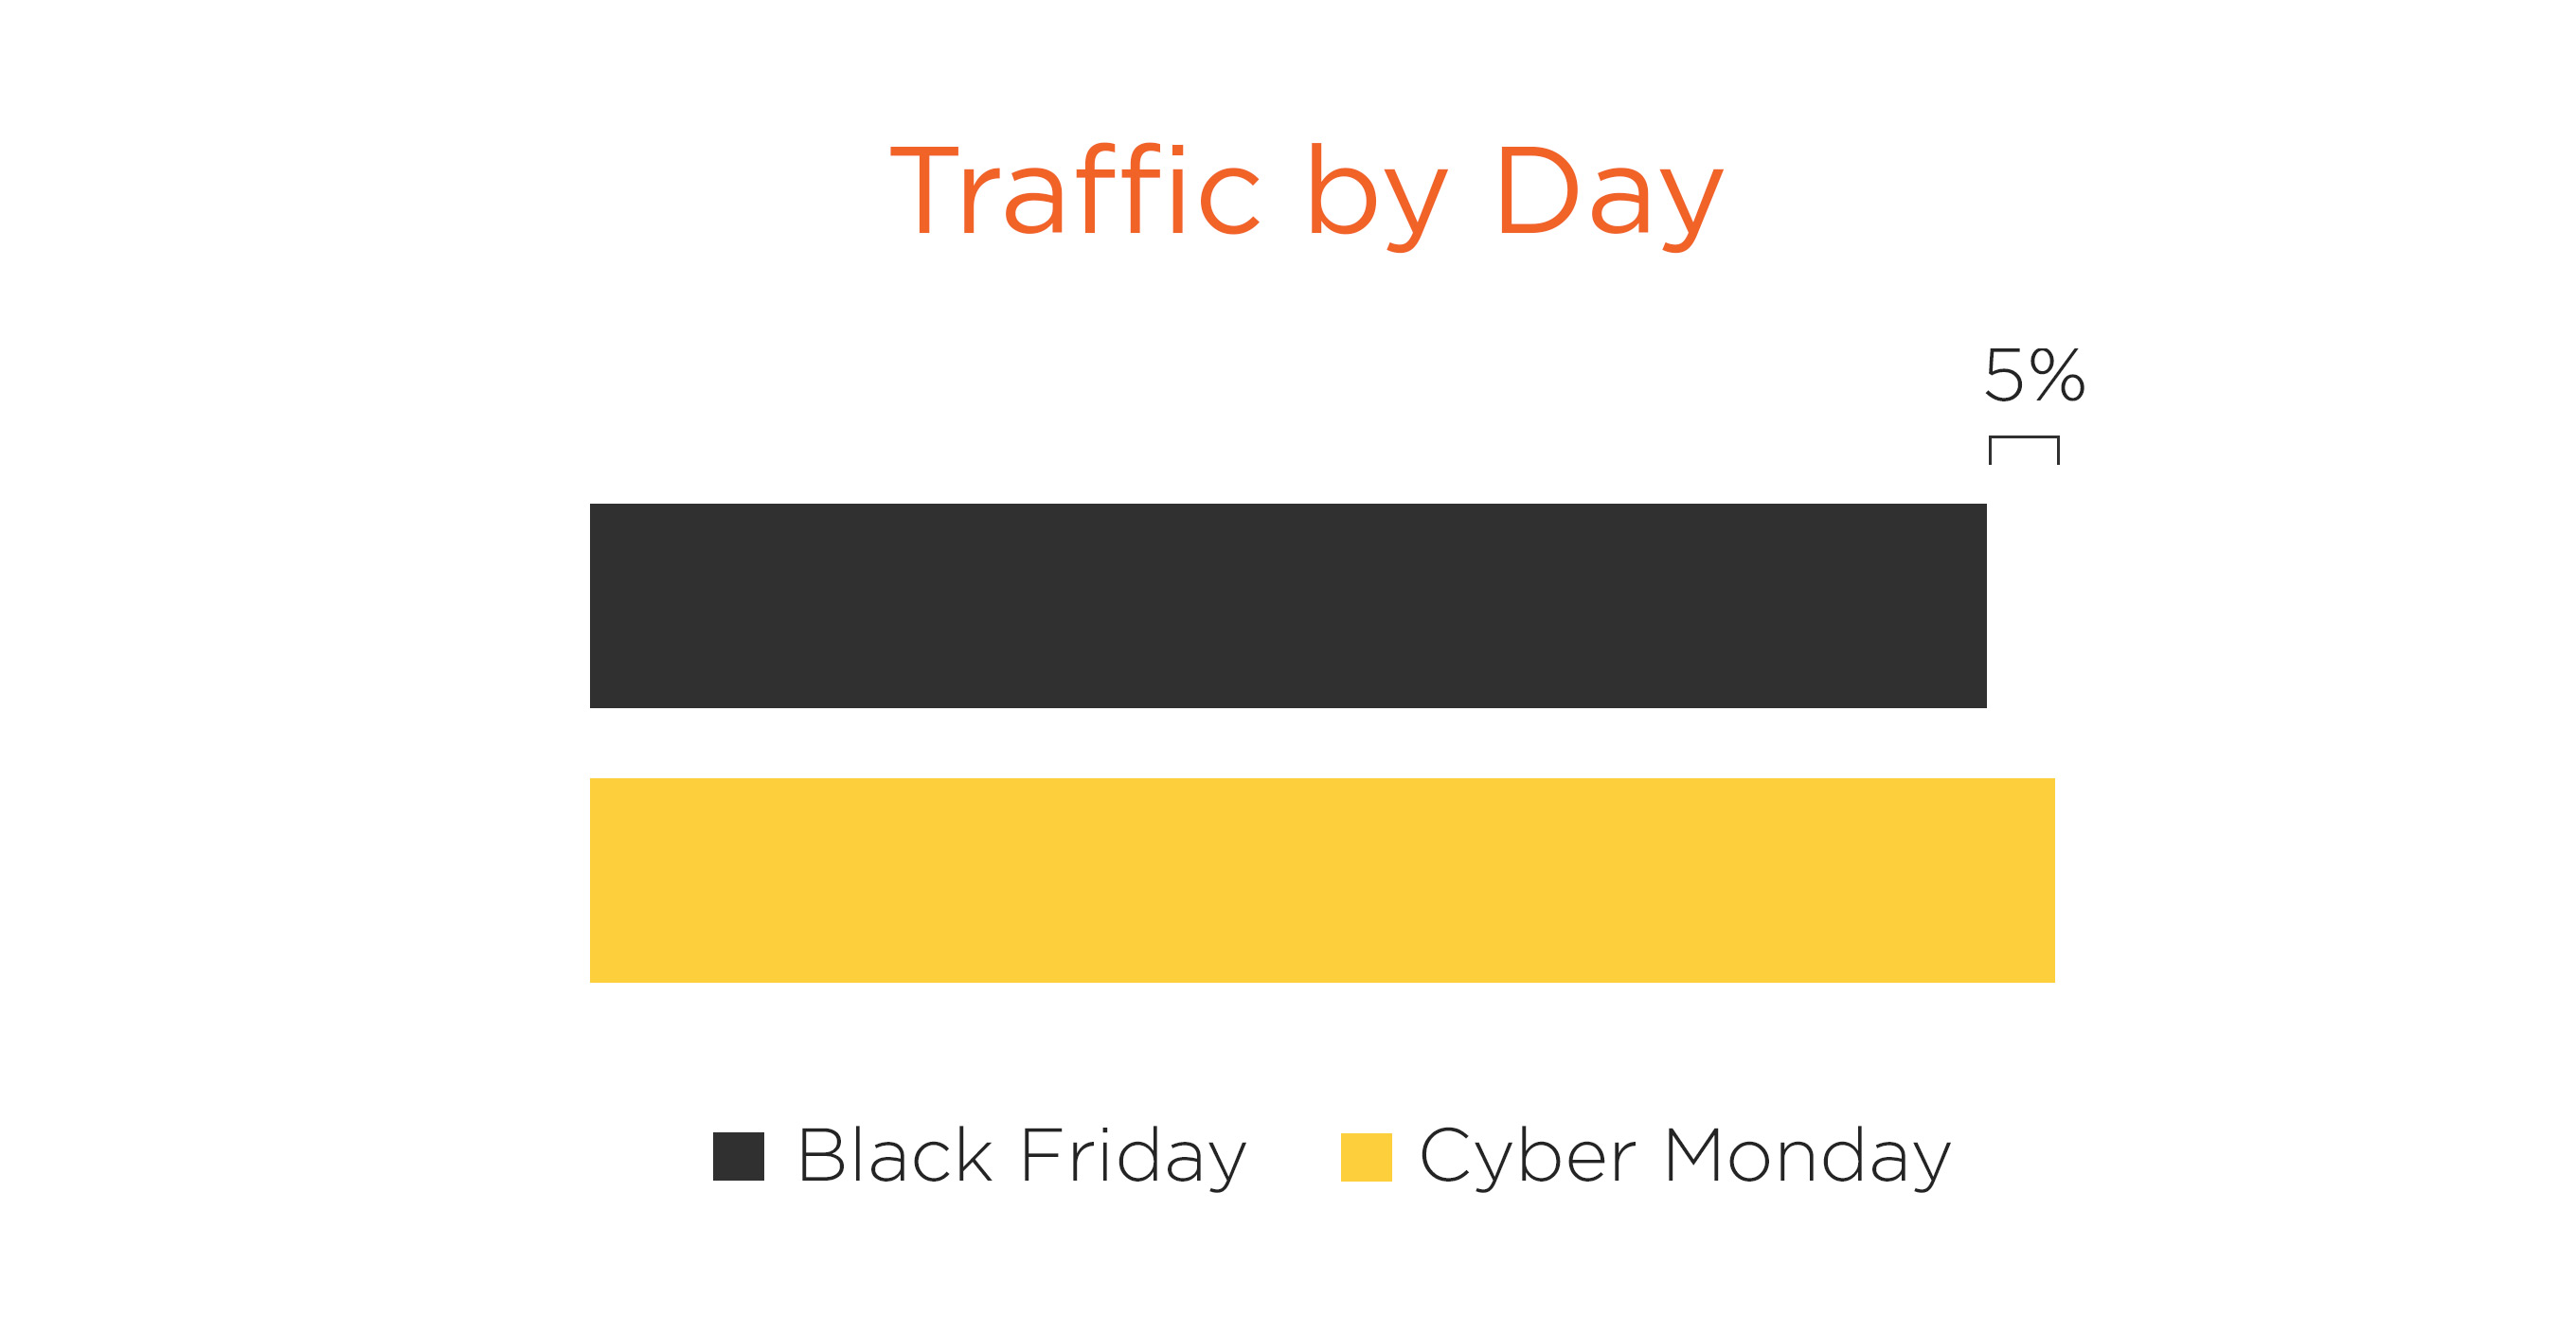
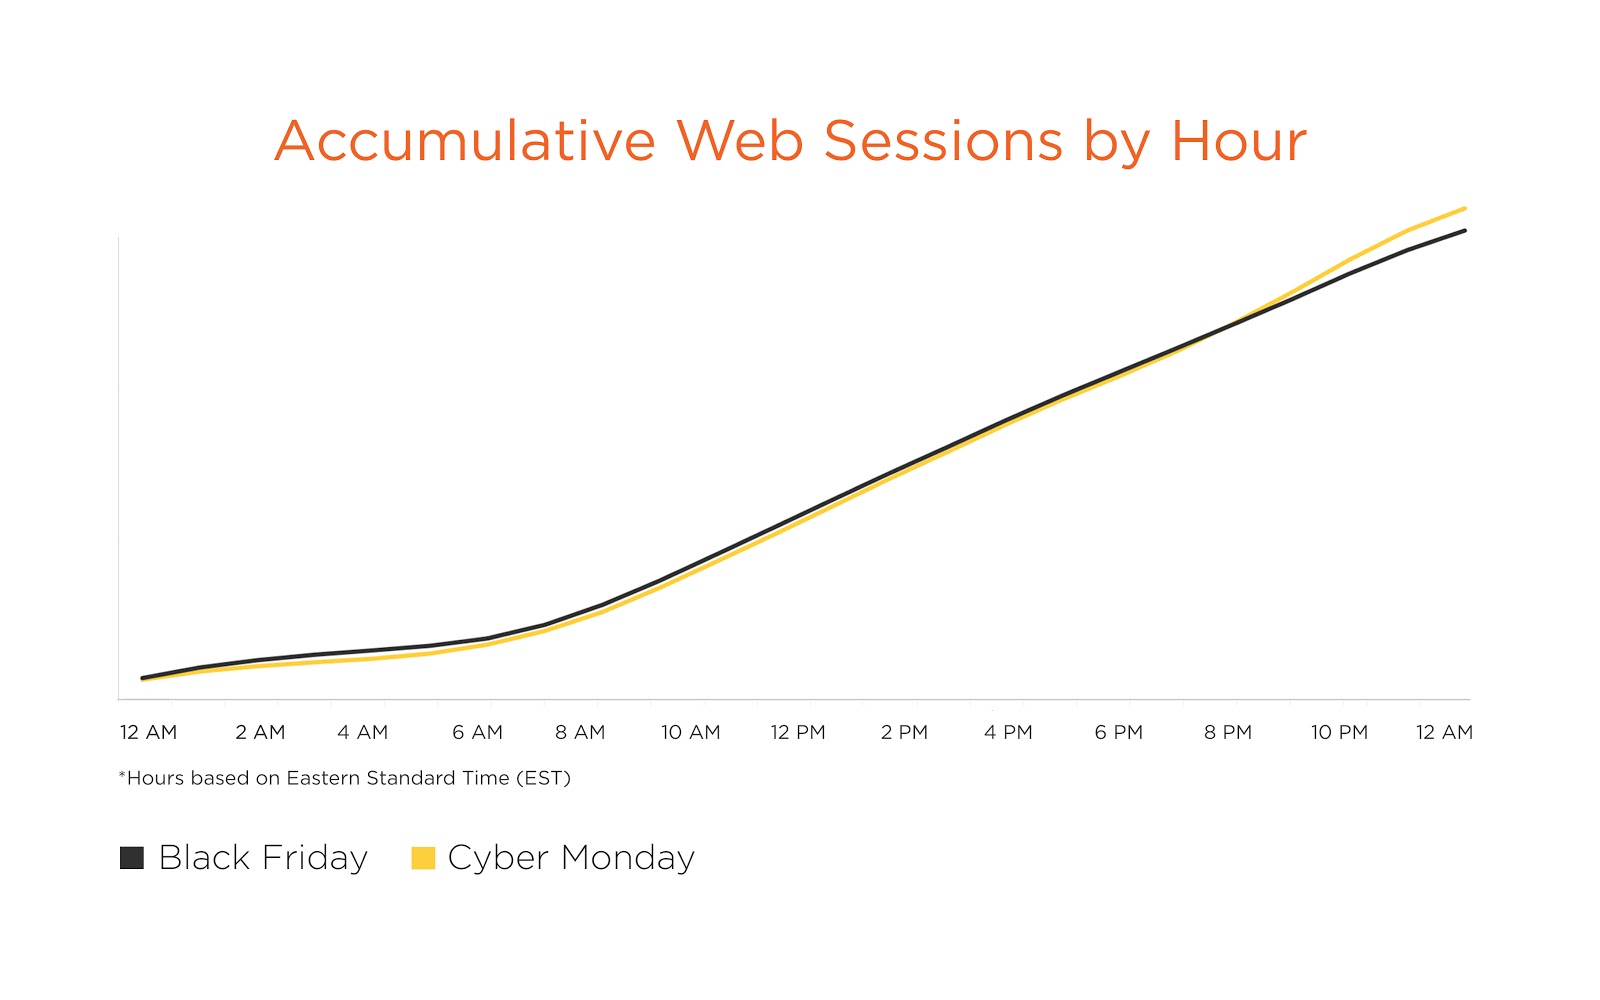
We honed in on U.S. eCommerce businesses to find out how these mega shopping days fared head-to-head. When it came to traffic, web sessions on Cyber Monday were 5% greater than on Black Friday:
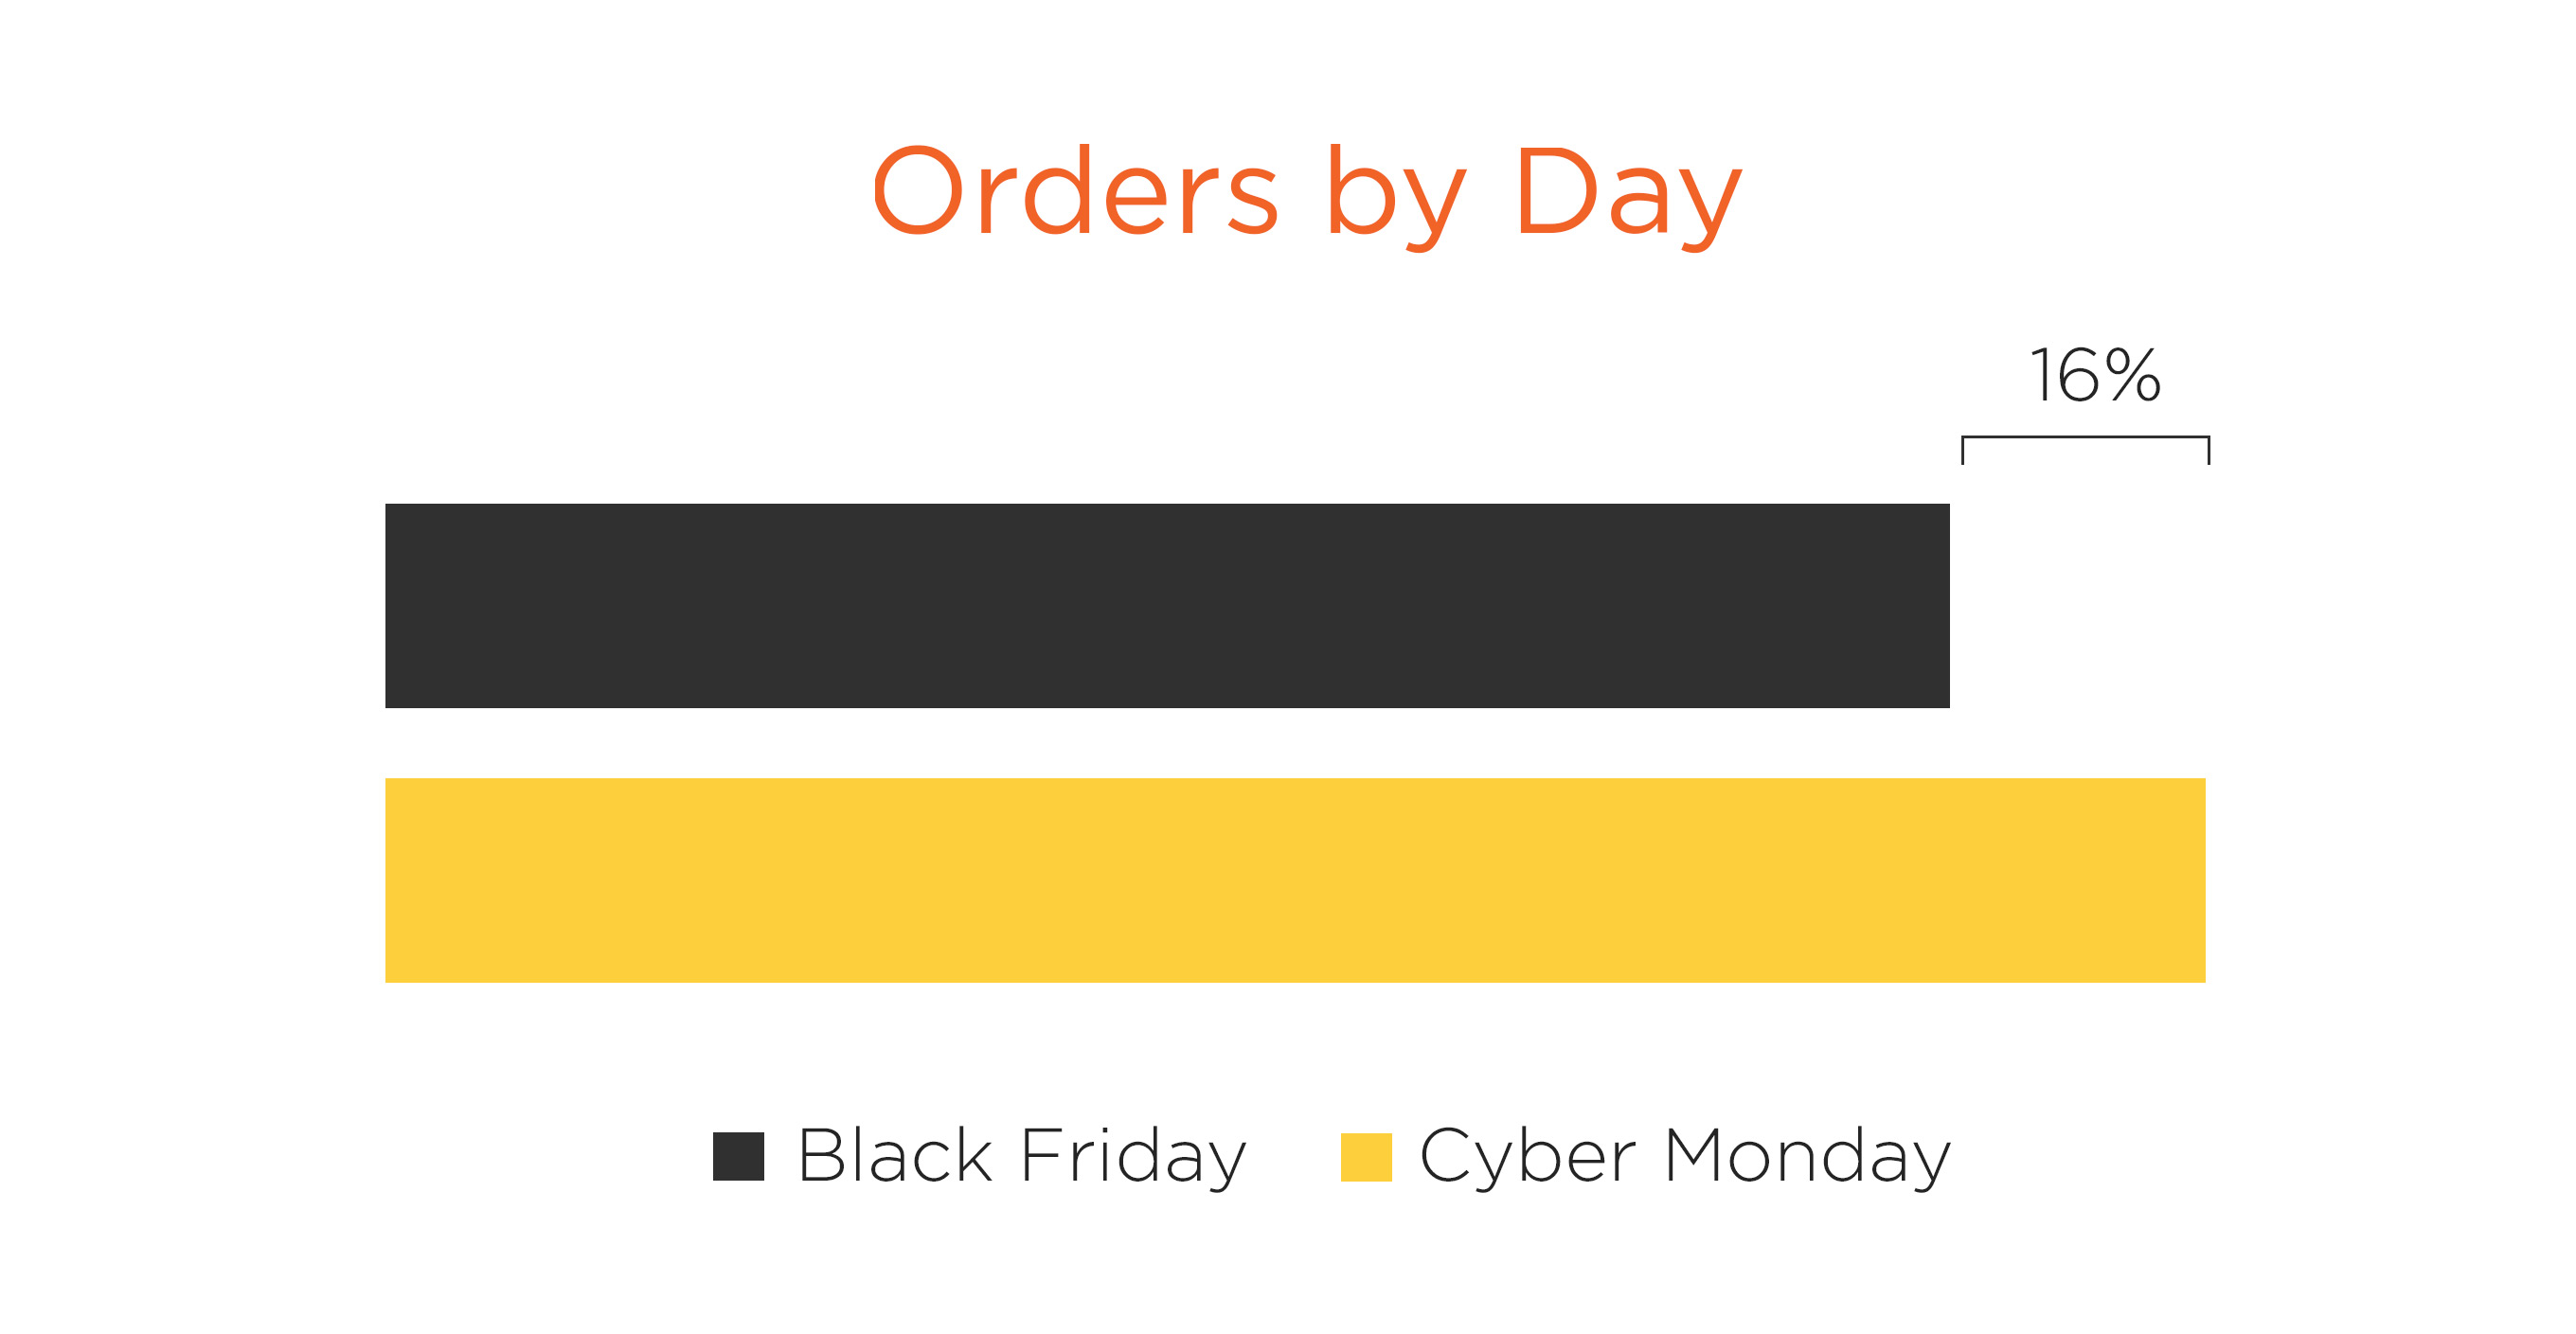
Completed orders on Cyber Monday beat out Black Friday by a significantly wider margin at 16%:
How did mobile and desktop metrics on Black Friday compare to Cyber Monday?
Here’s how key metrics compared by device for both of these days:
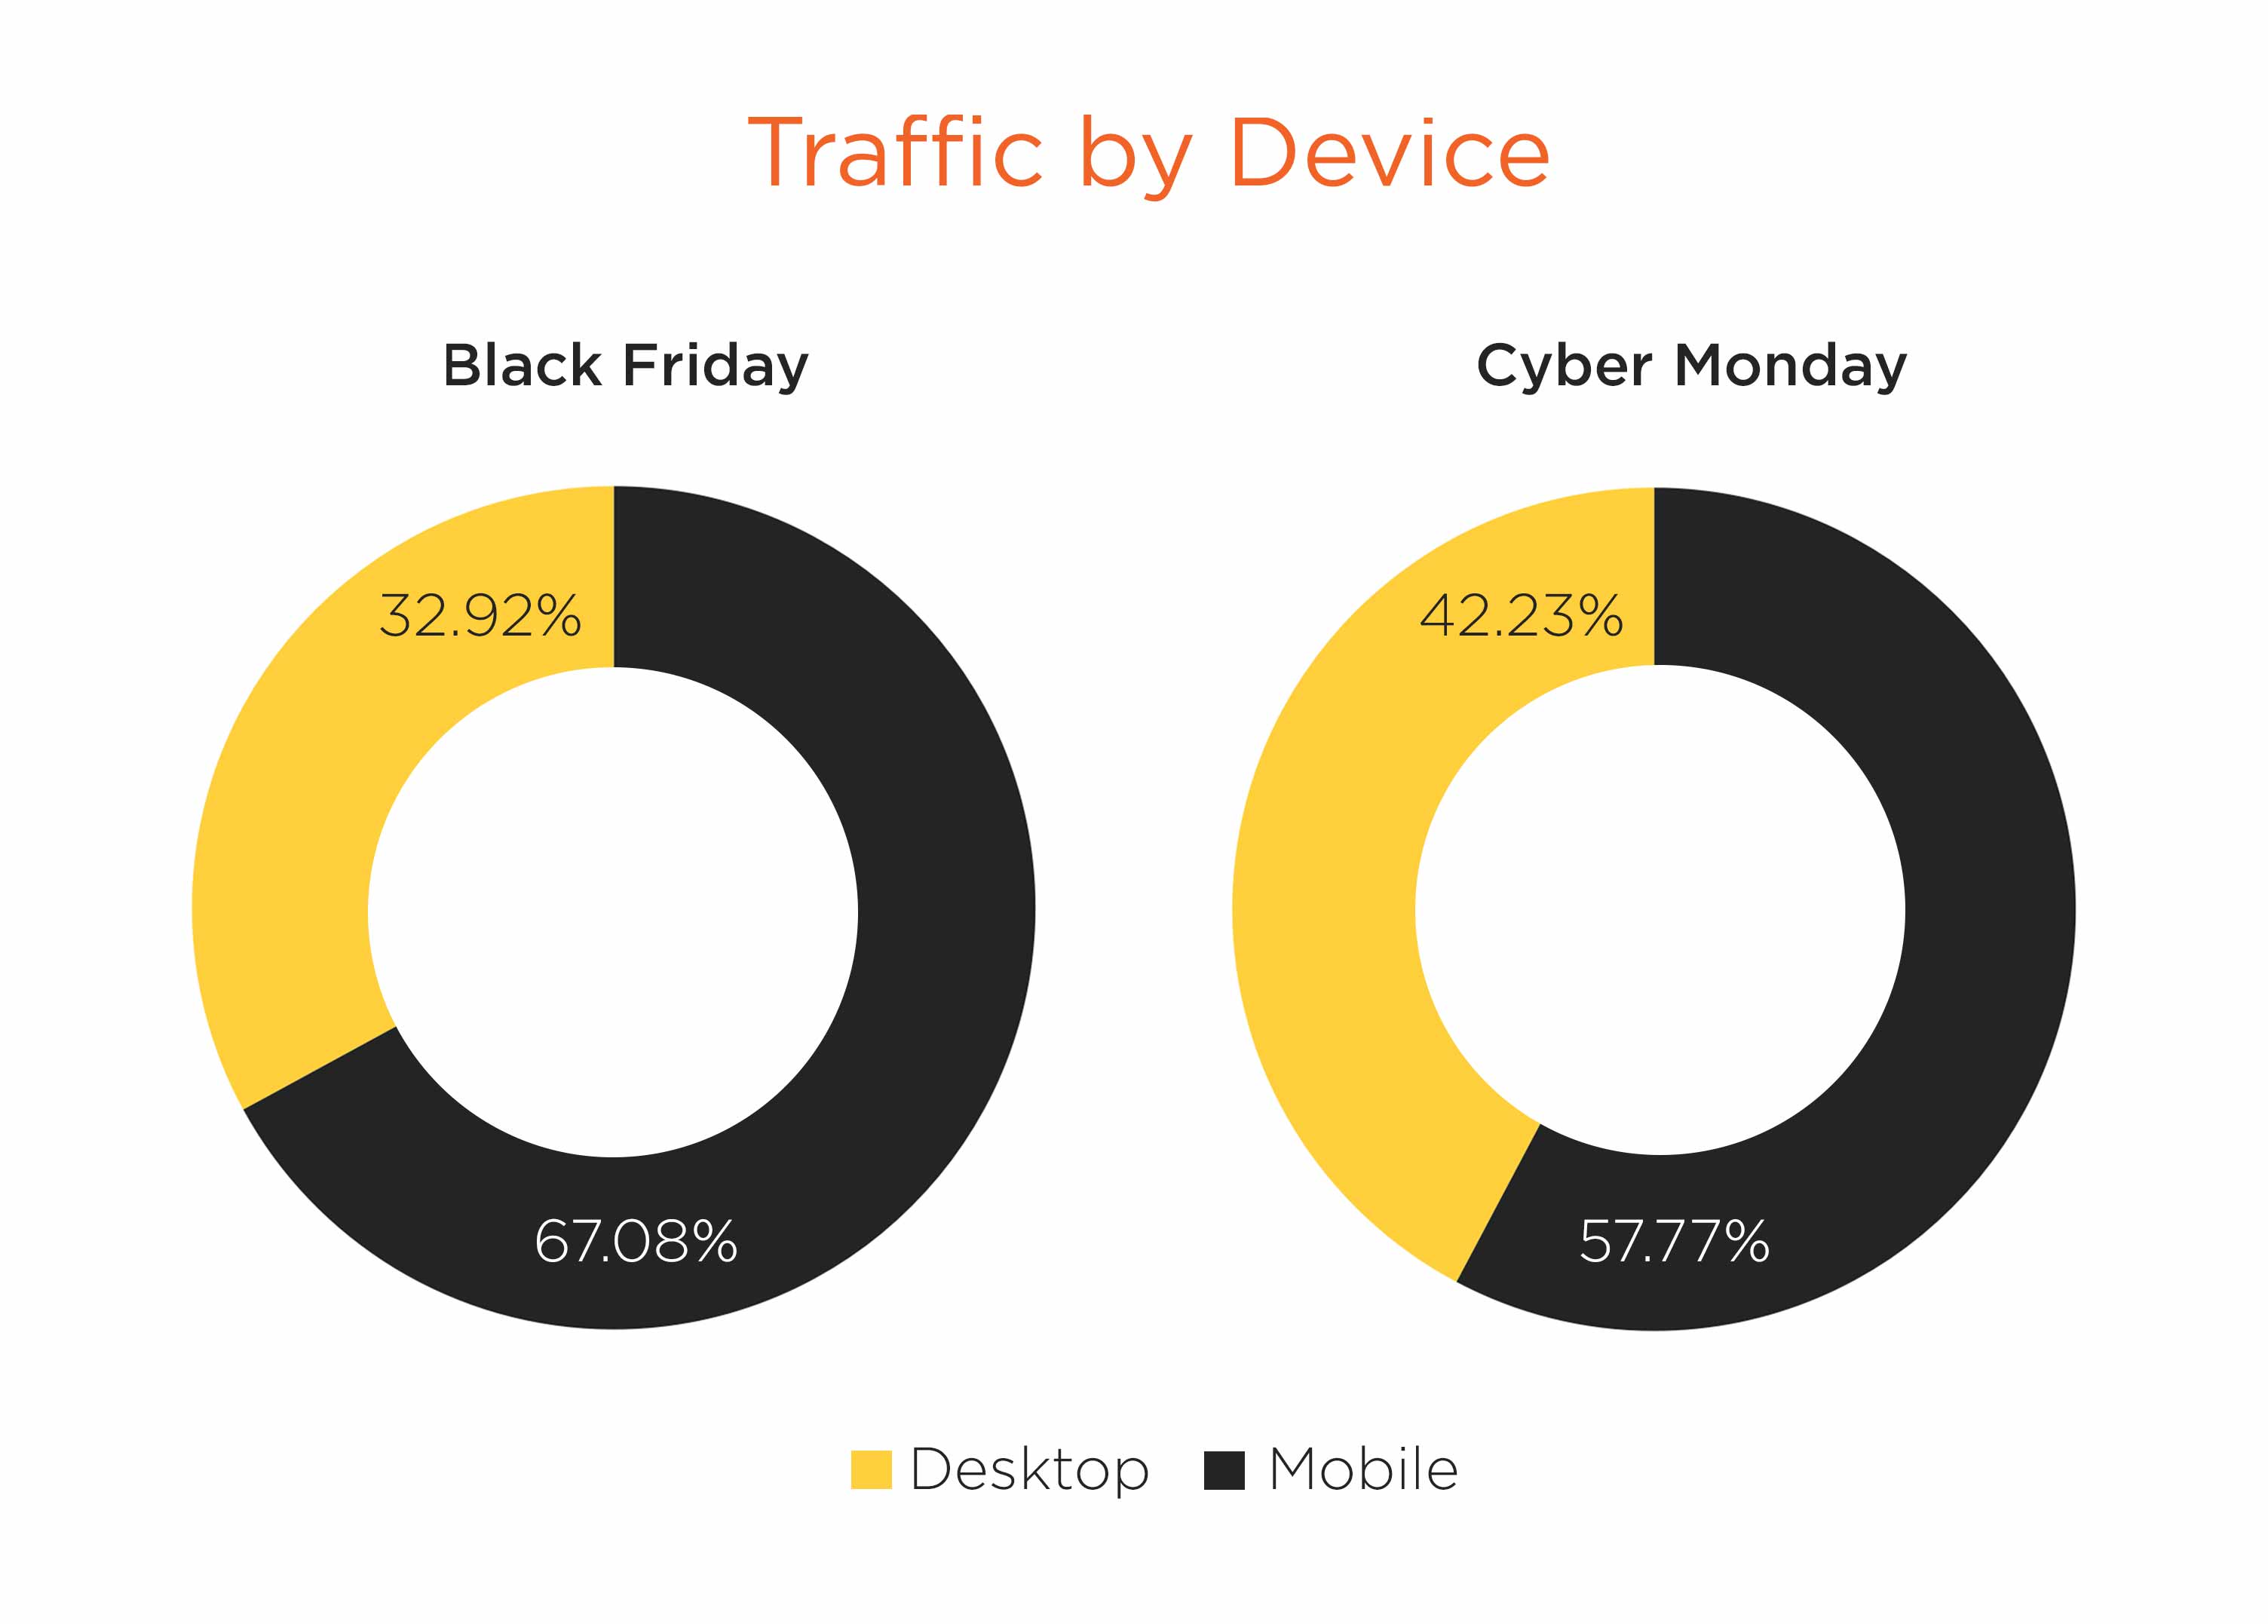
Traffic:
- Black Friday: 67.08% of all site traffic came from mobile devices compared to 32.9% on desktops
- Cyber Monday: 57.8% of traffic came from mobile vs 42.2% desktop
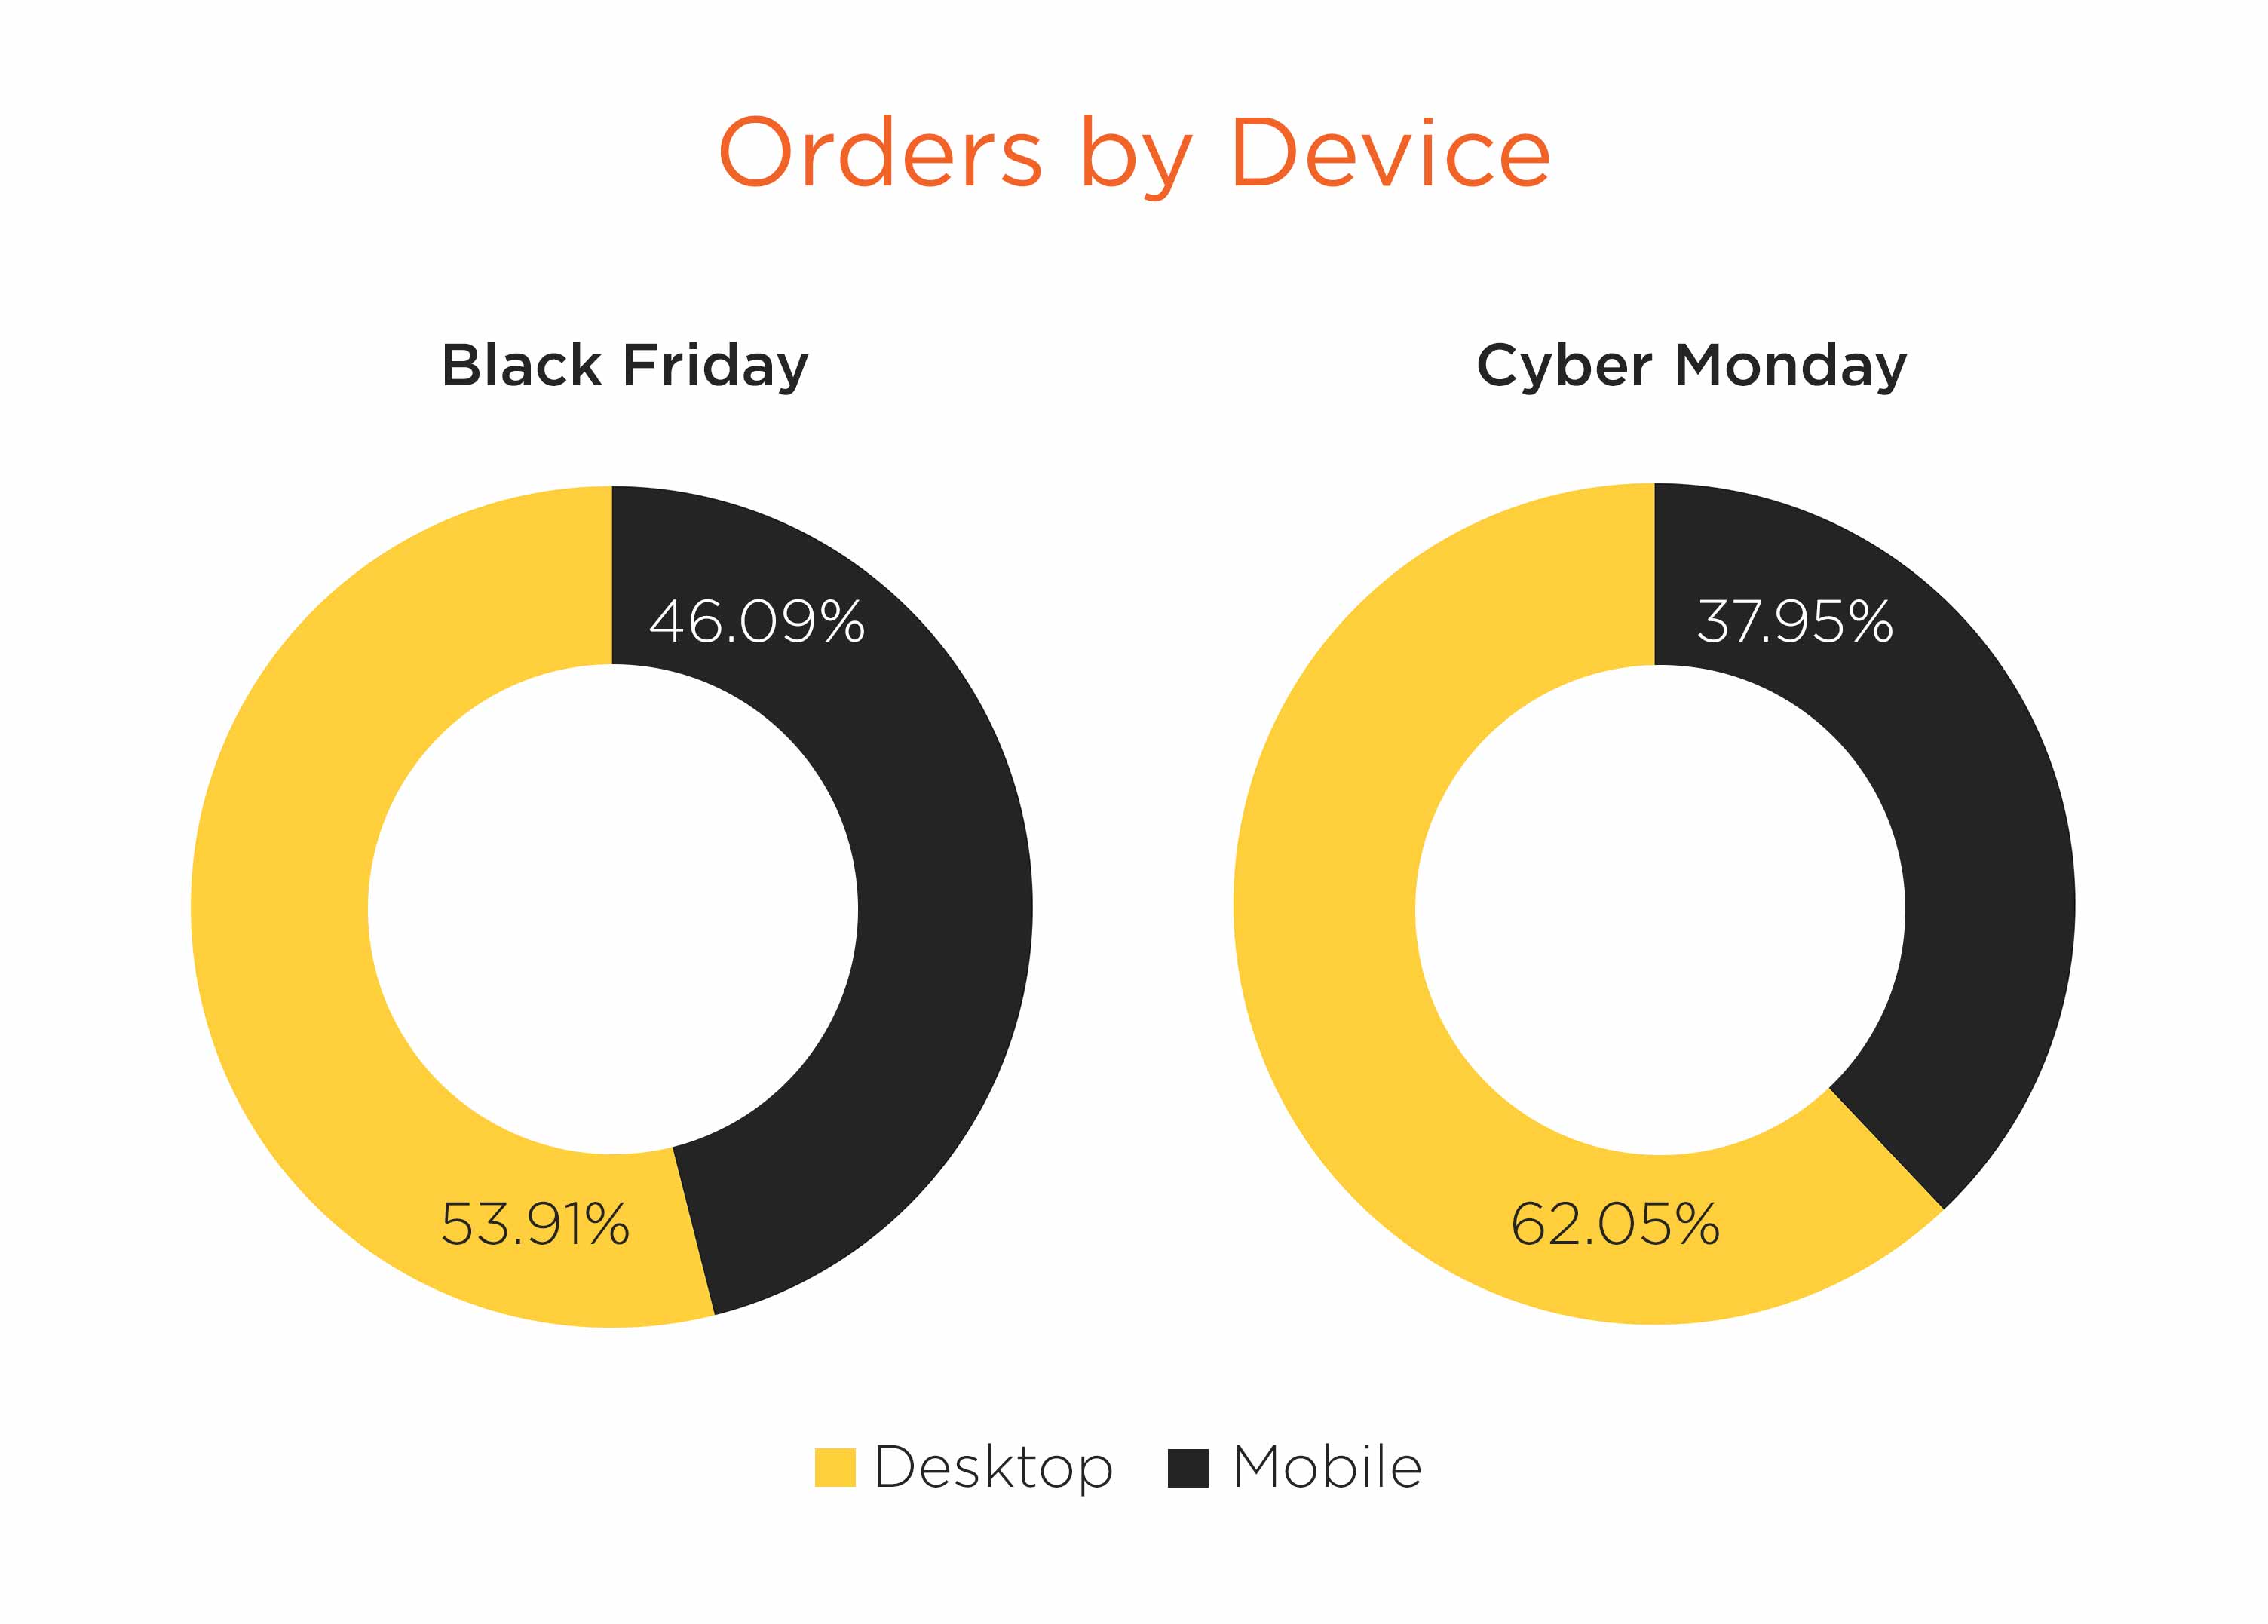
Orders:
- Black Friday: 53.91% of online orders were made on desktops, compared to 46.09% on mobile
- Cyber Monday: 62.05% of online orders were made on desktops, compared to 37.95% on mobile
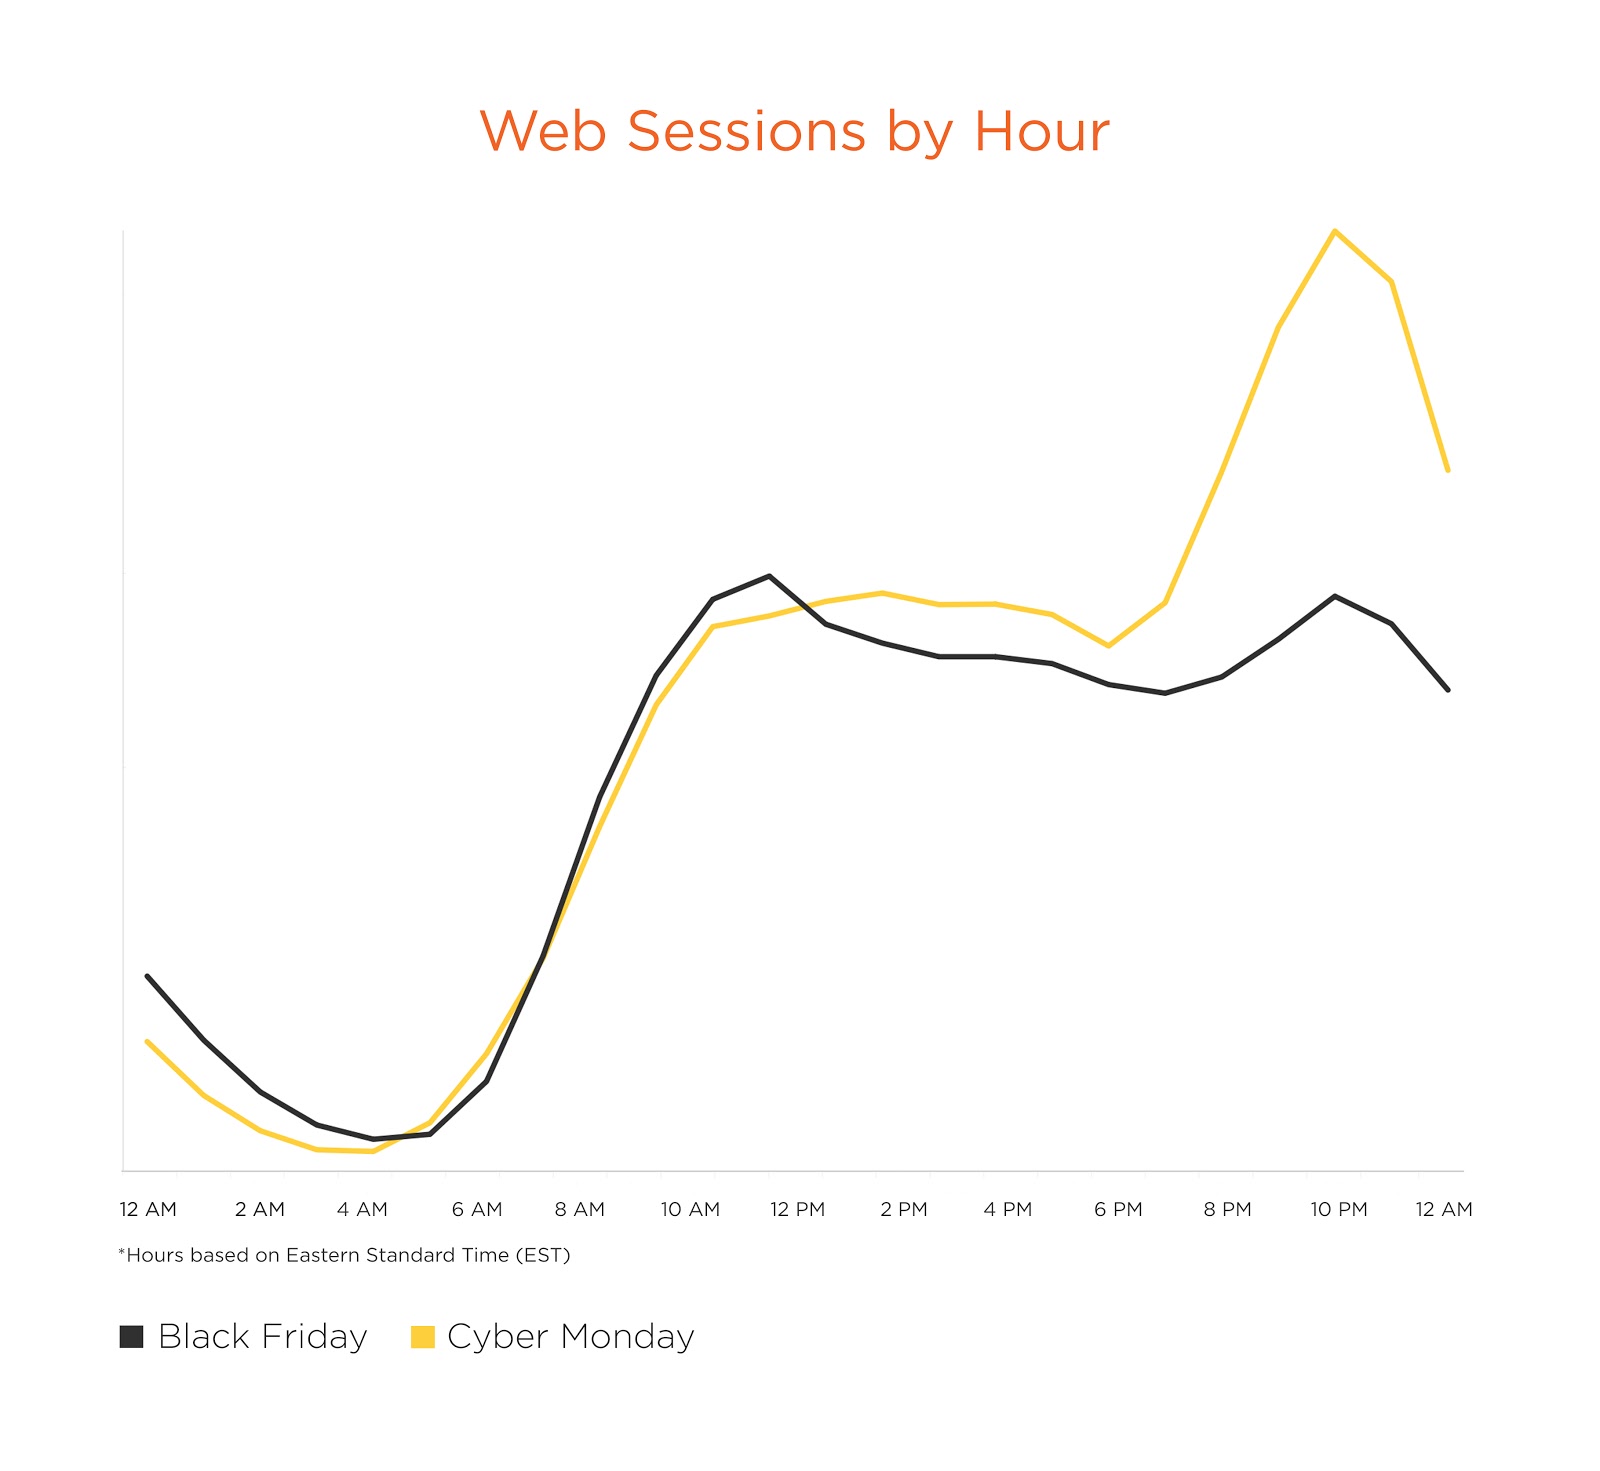
When did Online Shoppers Browse and Buy the Most?
Black Friday
- Black Friday traffic started gaining momentum at 7 a.m., almost doubling by 8 a.m.
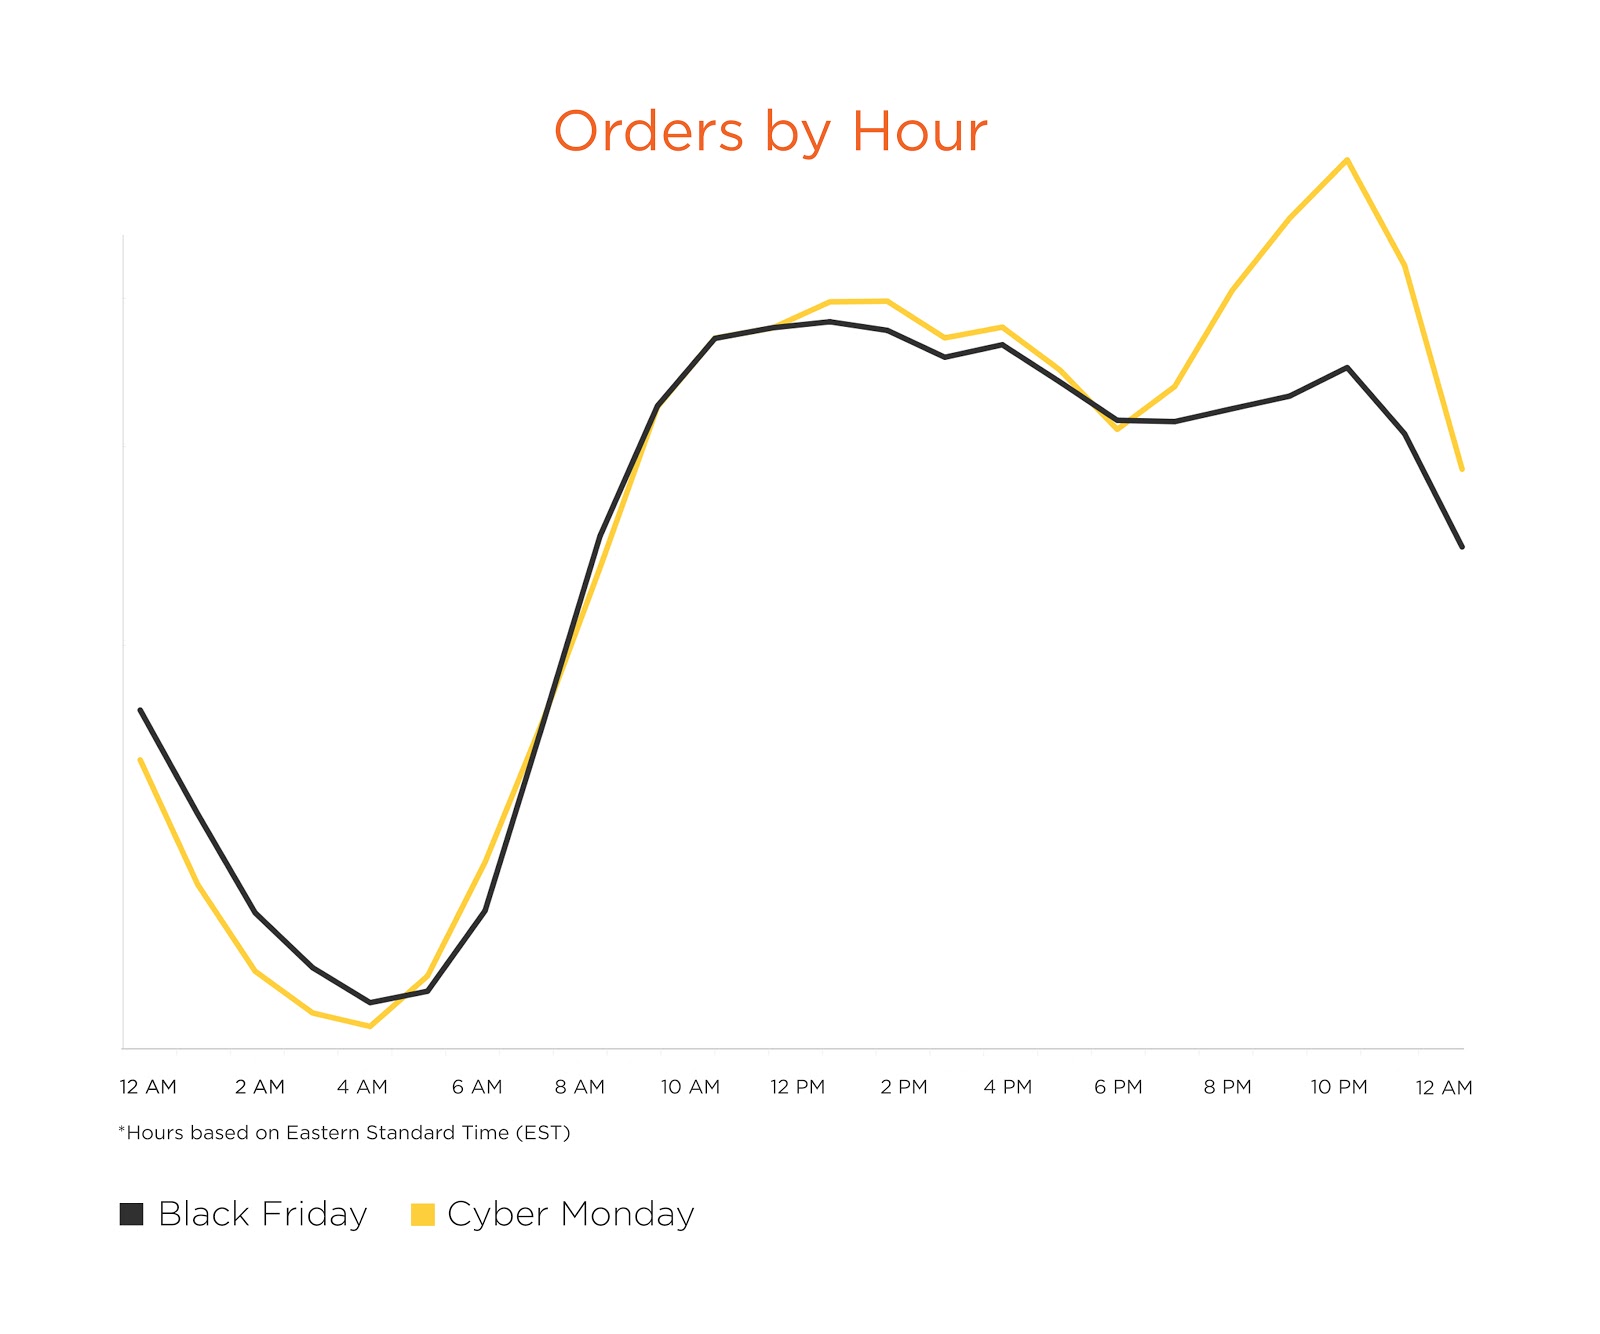
- Orders started rising gradually at 6 a.m. before they plateaued close to 11 a.m. Orders spiked significantly again between 9 and 10 p.m.
Cyber Monday
- Traffic increased steadily throughout the day but spiked significantly between 9-11 p.m.
- Orders began to rise markedly higher relative to previous weeks right out of the gates on Monday beginning at 12 a.m. Orders began increasing again dramatically in the evening after 6 p.m. and this trend continued until the day closed at midnight.
Note: Metrics and times for Black Friday and Cyber Monday were based in the U.S. and tracked for Eastern Standard Time (EST).
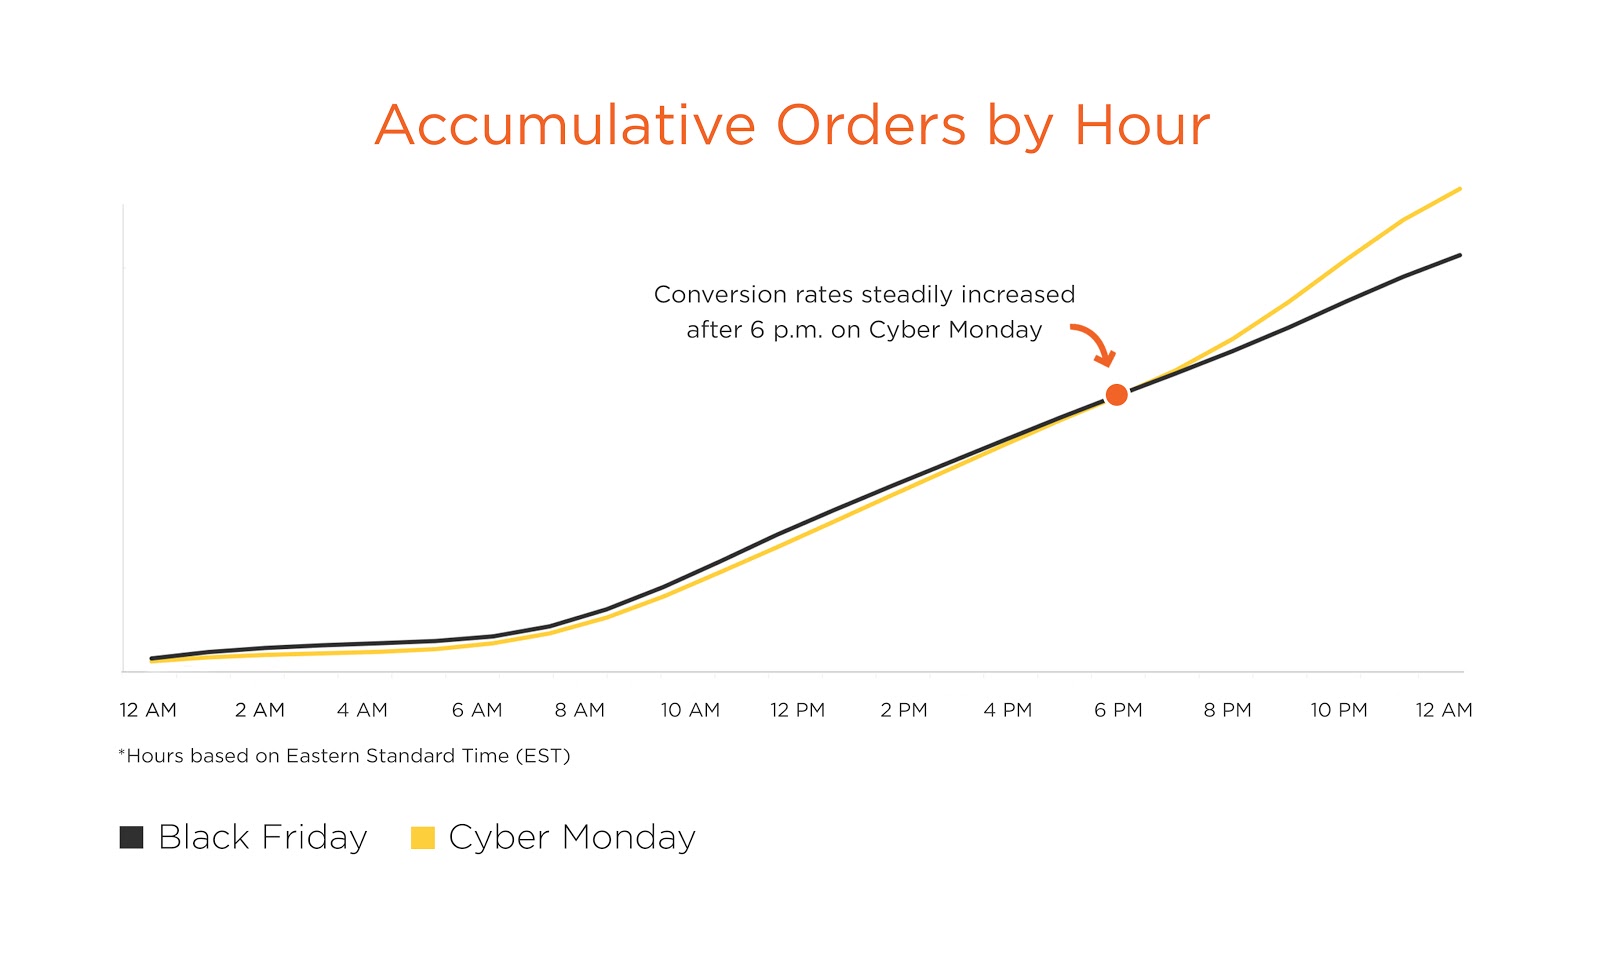
So why did Cyber Monday outperform Black Friday?
When tracking orders throughout both of these days, Cyber Monday began to dramatically pull away after 6 p.m. While sessions remained comparable for almost the entire day, conversion rates between 6 p.m. and midnight averaged out at 24.6% higher than Black Friday conversion rates for the same timeframe.
This highlights the fact that online shoppers actively browsed for the best deals available throughout the day, and in Cyber Monday’s closing hours, took advantage of them and placed their orders.
Which Verticals Were the Biggest Winners on Cyber Monday and Black Friday?
Here are the verticals that enjoyed the most significant increases in online orders on Black Friday and Cyber Monday when compared to the previous six Mondays and Fridays, respectively:
Black Friday
- Electronics: Orders increased by 664%.
- Footwear: Orders increased by 643%.
- Apparel: Orders increased by 601%.
Cyber Monday
- Electronics: Orders increased by 746%.
- Footwear: Orders increased by 686%.
- Apparel: Orders increased by 456%.
Customer Journey Hijacking rates rise to skim even more traffic & revenue
While these Black Friday and Cyber Monday 2018 figures point to success for the online retail industry, Customer Journey Hijacking rates also swelled to skim earned web traffic and revenue via unauthorized ads injected into consumer browsers, including product ads, banners, pop-ups, and in-text redirects that disrupt site visitors and divert them away to competitor promotions. In fact, research has found that 55% of online visitors are likely to click on a competitor’s ad, injected into the browser.
During Black Friday and Cyber Monday, Customer Journey Hijacking activity increased between 40-60% at various hours of the day compared to the regular season, where injected ads impact consumers during 15-25% of web sessions.