


A/B testing is the bread and butter of website optimization. Almost any change to a website can (and probably should) be put through an A/B test to determine which experience will drive the best results. In some companies, dedicated teams run dozens of tests simultaneously to understand everything from which font increases average page view time, to which color a call-to-action button should be.
When it comes to eCommerce tests, there are several metrics that can be tracked to determine the impact of a change to the UX or a new third party service. But which metric is king? Based on our experience running dozens of POVs with top retailers in North America and Europe, we weigh in on which eCommerce metric will show the clearest winner in an A/B test.
Conversion Rate Uplift:
Conversion rate uplift is the classic metric to measure any sort of commercial experiment. It can be used as the measuring stick for both marketing and eCommerce initiatives and answers a fairly simple question: Which experience is going to result in the highest number of visitors converting, completing an objective, or accomplishing a goal?
The benefit of using conversion rate as a measure is that it does not necessarily have to have a monetary value associated. More registrations, more clicks, more purchases can all utilize conversion rate as the key business metric. The downside, however, is that conversion rate views all conversions as equal, and is blind to the true value of the change in consumer behavior.
Let’s take a scenario in which a home goods retailer sells a selection of products ranging from $5 trinkets to four-figure furniture and consumer electronics products. Suppose we were to run a marketing campaign offering a free $5 iTunes voucher for any purchase in the store. We may, at first glance, see that the conversion rate shot up significantly and consider the campaign a success. However, on closer inspection, we find that the sale of $5 trinkets increased significantly while the sale of more expensive items barely registered a change — not quite the desired outcome.

Conversion rate uplift is great for measuring the volume of visitors converting, but not the additional revenue they are generating. For that, we’d want to look at another eCommerce KPI — average order value (AOV).
AOV:
When measuring a campaign based on AOV, we can easily examine whether or not visitors spend more when exposed to different experiences. For example, an online fashion retailer that has an average order value of $43 decides to do an A/B test in which some visitors will receive free shipping on orders of $50 or more.
In this experiment, if we see the AOV increase in the group being offered free shipping, we can assume that the free shipping is encouraging visitors to spend that little bit extra for an incentive. Often times, visitors will spend more to get that free shipping incentive. If the rise in AOV offsets the cost of providing shipping for free, a business can theoretically increase revenue without any conversion rate uplift.
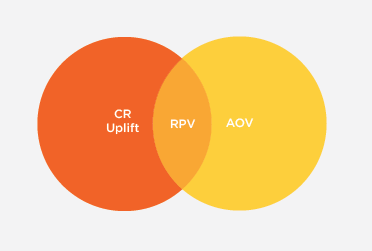
When measuring conversion rate uplift and AOV together, you can get a pretty good picture as to the true value of the experiment. In fact, when you combine them you get the clearest metric of all, revenue per visit (RPV).
RPV:
Revenue per visit is our preferred metric when measuring the impact of a POV. The reason for this is because it assigns a value to each visitor to your site. Your marketing team is investing significantly in bringing each visitor to your website. It stands to reason that if there is a cost of acquisition per visit, you should be able to measure the revenue each visit is driving as well.
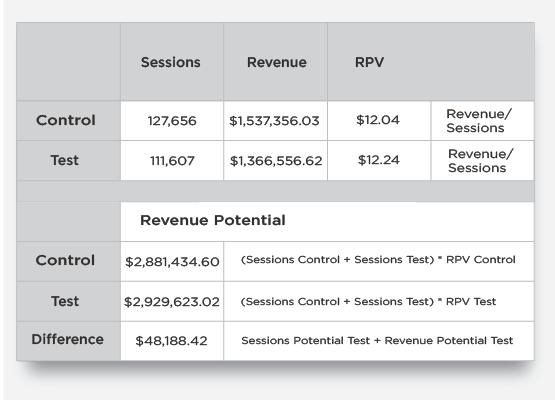
There are two methods of calculating RPV, either by taking the total revenue of the group and dividing by the number of visitors in that group, or by multiplying the conversion rate by the AOV. The result will let you know how much revenue each visitor is worth to you.
Once you have calculated the RPV for each group, simply multiply the total sessions (for both groups) by the RPV per group in order to understand the true incremental difference in value between your control and test environments. Namogoo recommends using acalculator to determine that the difference in RPV is statistically significant.
When measuring the effects of a change to your website, conversion rate uplift and average order value are popular eCommerce metrics, but both have blind spots that may invalidate the apparent value of a new campaign or third party service.
It’s no surprise that many A/B testing tools including Google’s Optimize service incorporate RPV as a key metric. By turning the focus to revenue per visitor, you will be able to determine whether a change to your website is really meeting the goal of driving more value to your business, and not just increasing one metric at the expense of another.