


THE VALUE OF THE HIJACKED CUSTOMER SEGMENT
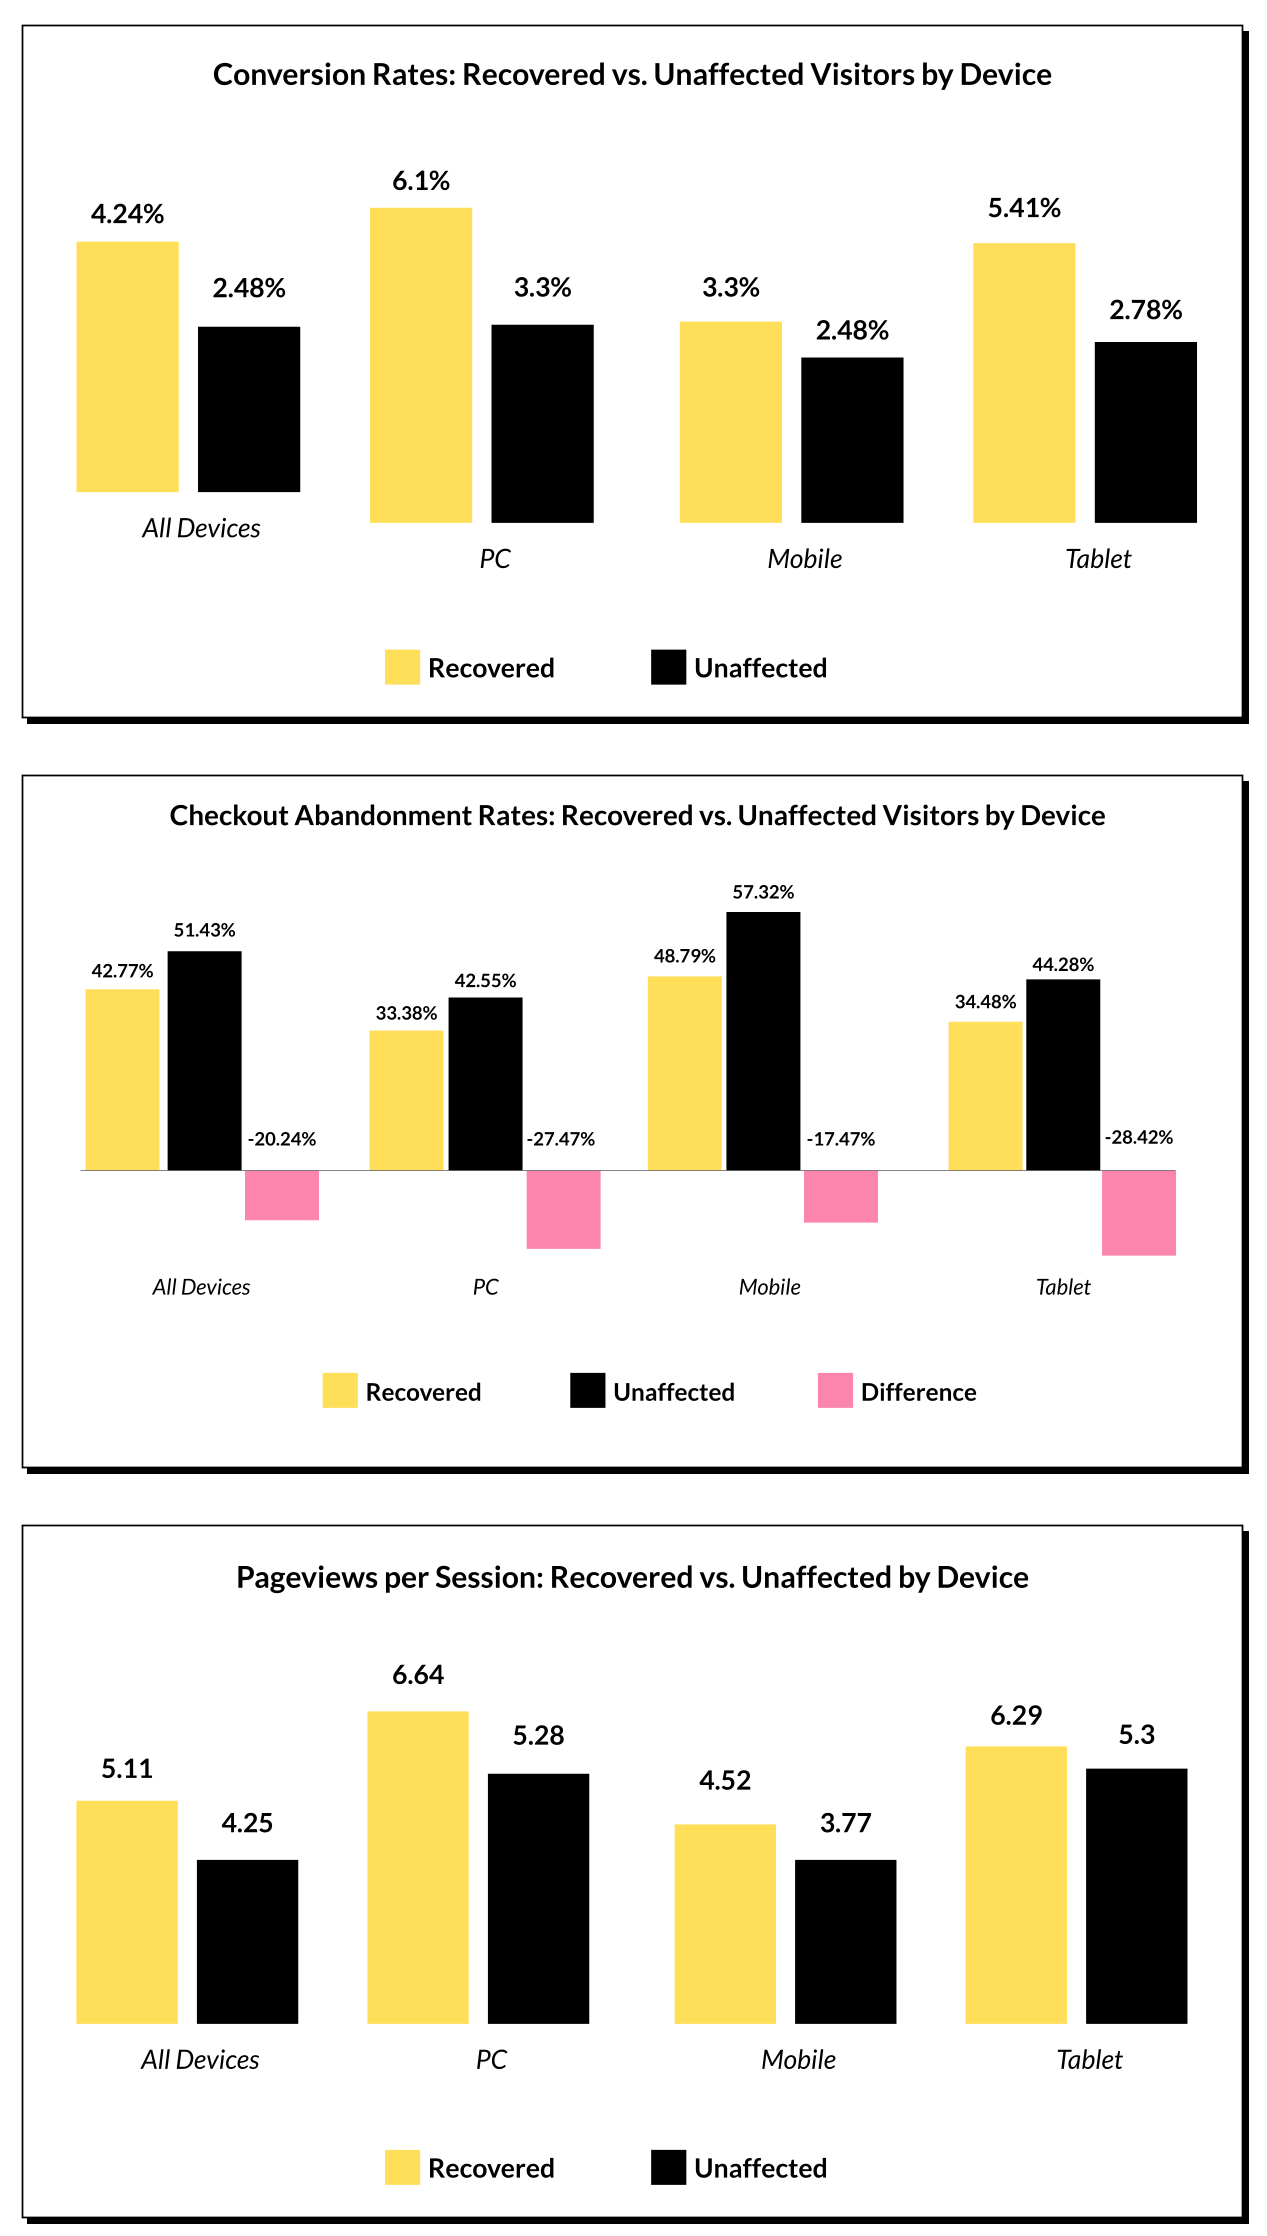
Our consumer session data shows that hijacked visitors are more active online and therefore more frequently download free software, extensions, and apps that are bundled with ad injection software. When blocking ad injections for hijacked visitors in the fashion and apparel industry, we can see that the recovered segment (those who were hijacked) convert 70% more when compared to the unaffected segment (those who were not hijacked)
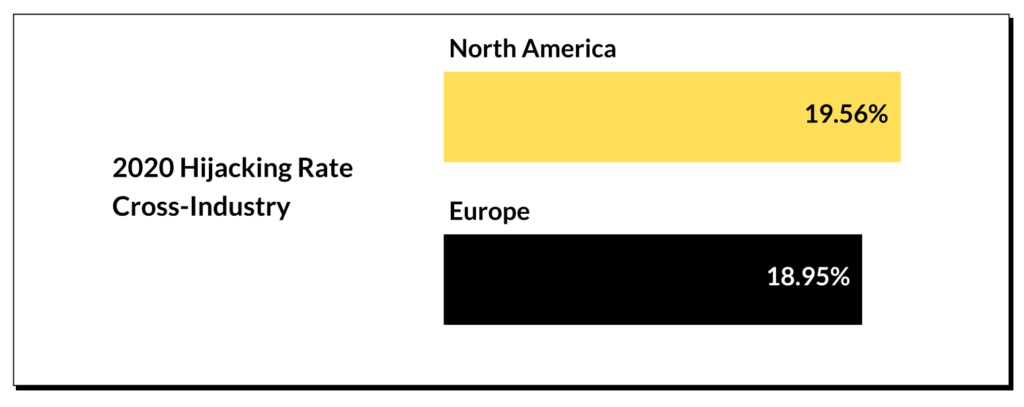
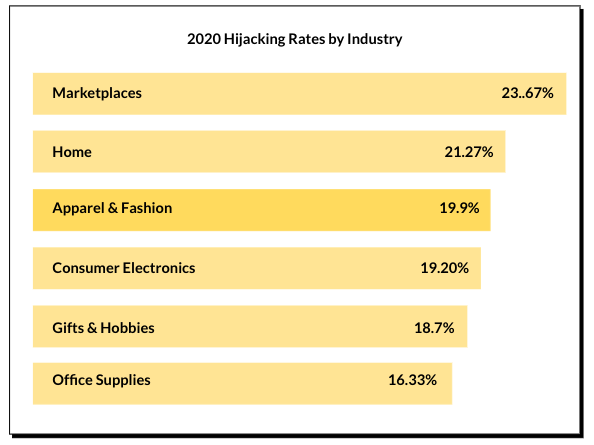
Before diving into your industry, here’s a high-level view of hijacking rates across industries in 2020:
THE IMPACT ON FASHION & APPAREL IN 2020
Online shopping has steadily grown year over year, replacing the brick and mortar retailers and opening up new opportunities to consumers. But the impact of COVID-19 has accelerated eCommerce traffic and sales in 2020 in record-breaking fashion. The competition for online customers has also increased as retail brands adjust to this new reality. Therefore optimizing the customer experience online and preventing disruptions that harm conversions and revenue are even more crucial. To give you a full view of the scale and impact of Customer Journey Hijacking, this report will break down hijacking rates and the impact on conversion for fashion and apparel retailers in 2020 to date.
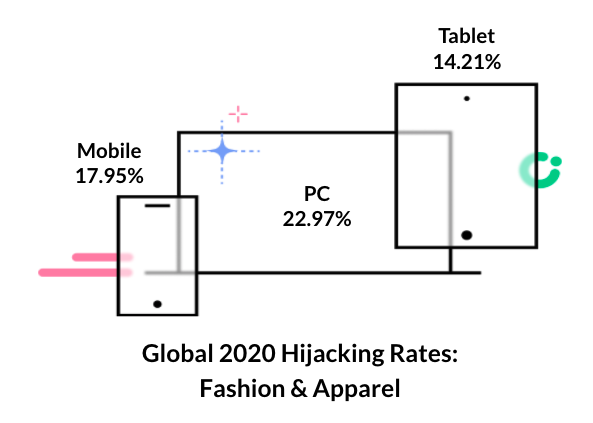
TOTAL 2020 HIJACKING RATE FOR FASHION & APPAREL
Now let’s zoom in on the scale of Customer Journey Hijacking in the fashion and apparel industry. In 2020, our consumer session data for clients worldwide shows that 19.9% of all visitor sessions to fashion & apparel retail sites are exposed to unauthorized ad injections.
OVERALL HIJACKING RATES VS. FASHION & APPAREL IN NOTABLE MARKETS IN NORTH AMERICA & EUROPE
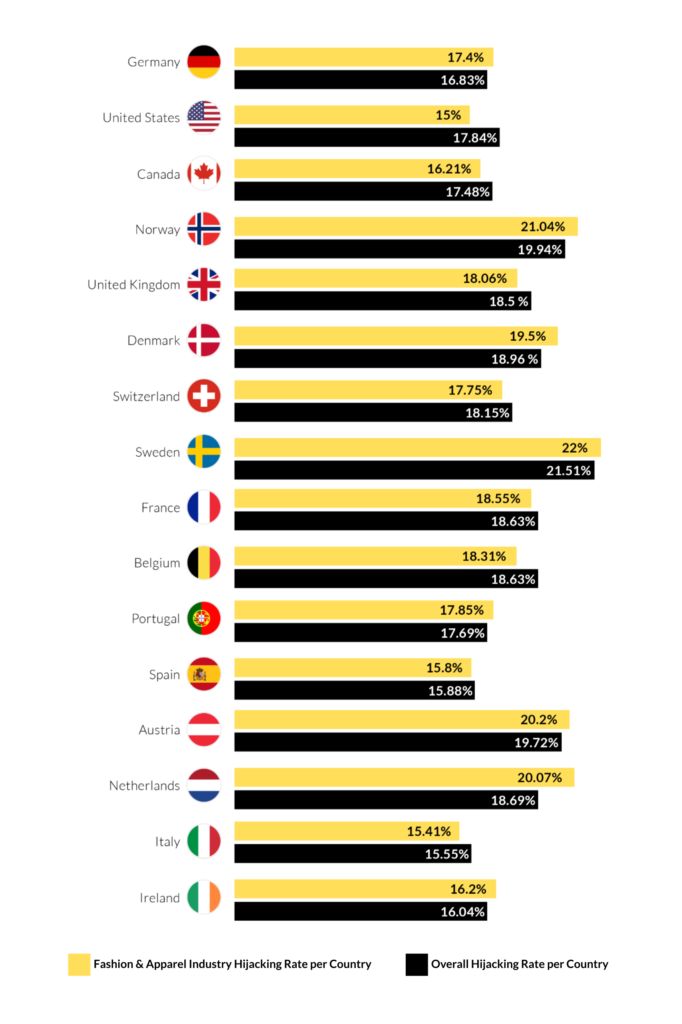
Looking at hijacking rates specifically in notable European and North American markets, we can see that more than 1 in 5 visitors are subjected to unauthorized ad injections when visiting a consumer fashion and apparel site.
2020 Hijacking Rates by Country
(notable European and North American markets)
HIJACKING RATES COMPARED TO OTHER INDUSTRIES
Here’s how the percentage of hijacked visitors to fashion and apparel websites compares to other industries in 2020:
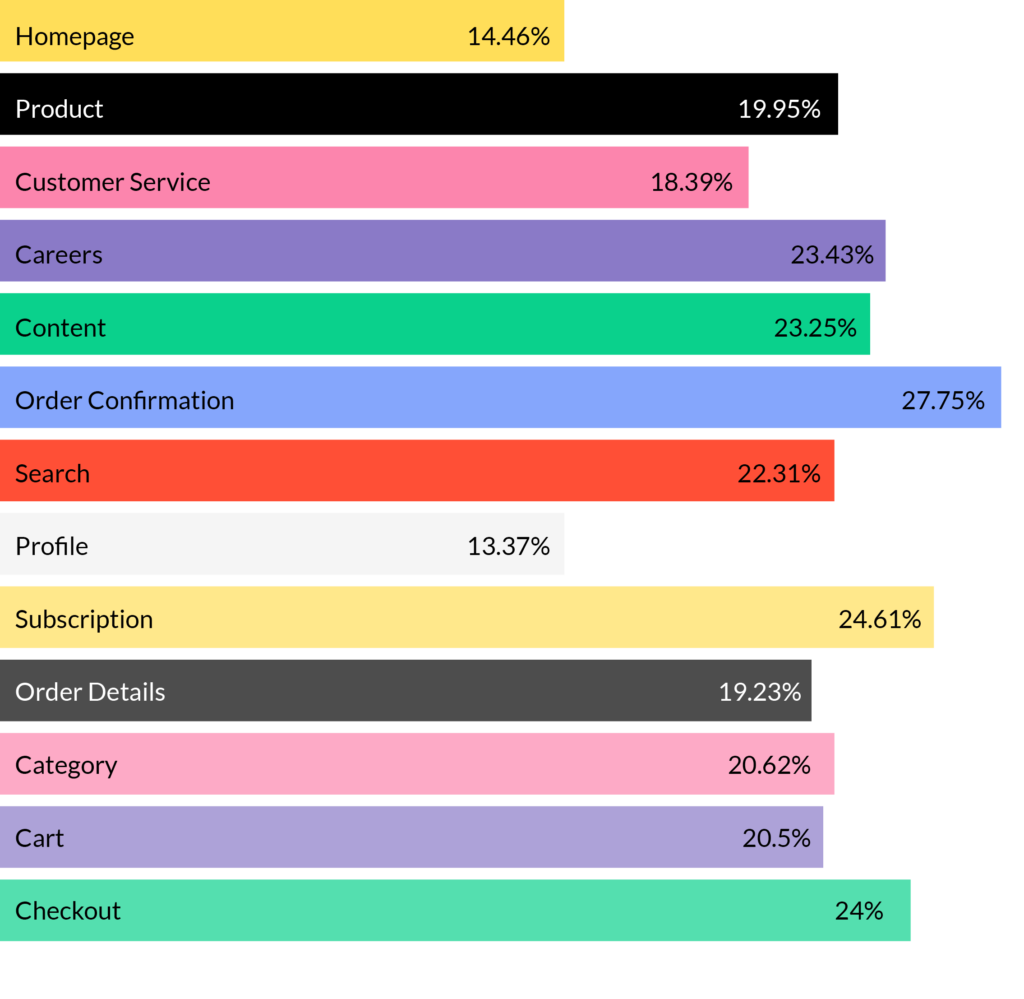
Hijacking Rates by Site Section
HIJACKING RATES COMPARED ACROSS DEVICES
Our data shows that hijacked visitors have higher shopping intent and therefore have higher conversion rates, lower checkout abandonment rates, and higher pageviews per session.