


ABOUT THIS REPORT
With the holiday shopping season behind us, now is the time for retailers to start examining the data and drawing useful conclusions. This report aims to support that effort by presenting Namogoo’s key findings regarding eCommerce during the peak weeks of late 2019.
There is no disputing the make-or-break power of this period for online retailers, and we were especially interested to see how this year’s sales event would play out in light of our expectation that it would be different than in years past.
The findings in this report are based on our analysis of more than 2.5 billion online shopping sessions in the U.S. and Europe. We gathered this data to answer some of the most important questions for businesses that rely on eCommerce, including:
- How did the peak shopping period impact eCommerce KPIs across regions and devices?
- Have mobile devices finally replaced desktops as the go-to device for consumers?
- Which verticals benefited the most from the holiday shopping season?
- How did Customer Journey Hijacking (CJH) affect online conversion rates?
This report covers eCommerce trends during two main time periods:
The pre-holiday period: October 21 – November 21
The holiday shopping season: November 22 – December 24
Key Findings
Mobile Conversions Eclipsed Desktop
For the first time, more orders were placed on mobile devices than on desktop or laptop computers during the 2019 holiday shopping season in both the U.S. and Europe.
Holiday Checkout Abandonment Rates Fell
Checkout abandonment rates were significantly lower during the holiday shopping season than during the pre-holiday period—a difference of 13.37% in the U.S. and 12.29% in Europe.
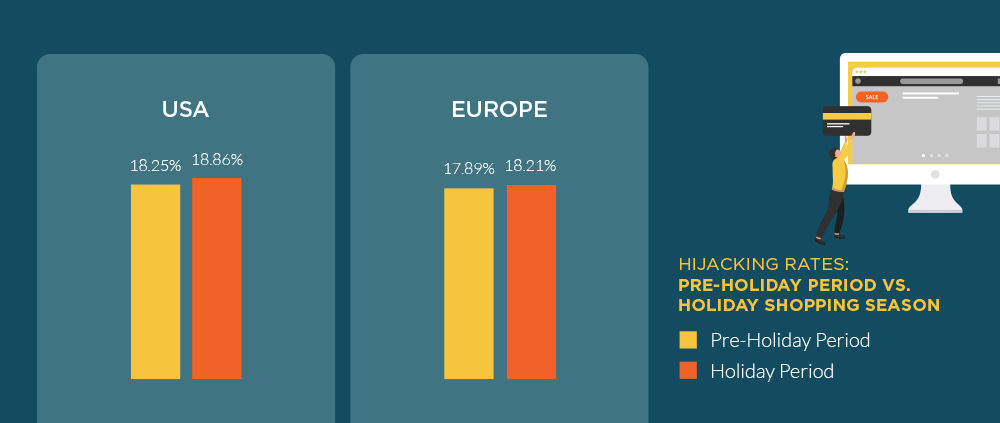
More than 18% of eCommerce Sessions Were Hijacked
Injected ads appeared during 18.86% of online shopping sessions in the U.S. and 18.21% of sessions in Europe over the course of the holiday shopping season.
Marketplaces and Home Retailers Were Hit Hardest by Ad Injectors
Online marketplaces suffered from injected ads more often than any other vertical in the U.S., while home retailers were most frequently impacted in Europe.
Protected Customers Converted Over Twice as Often
Injected ads disproportionately targeted the most promising shoppers. After Namogoo blocked these ads, those consumers converted over 2.7 times more often than users who were not targeted by injected ads.
U.S. DATA
ECOMMERCE KPIs JUMPED
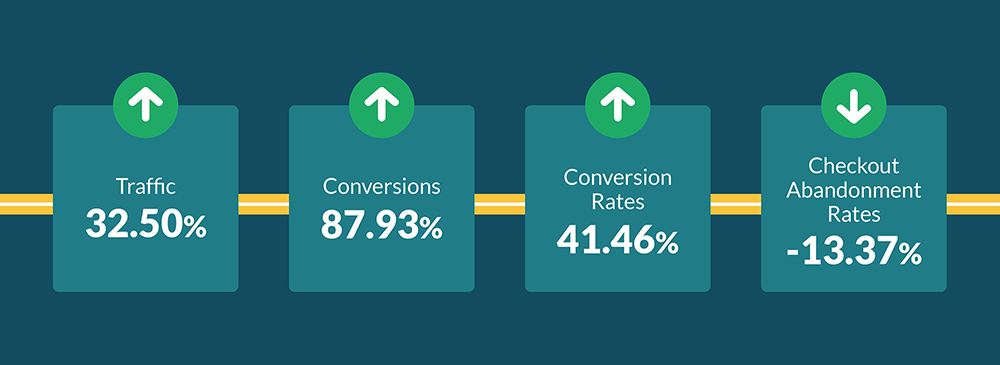
Cross-device metrics across the board in the U.S. were significantly higher during the holiday shopping season (November 22 through December 24) than during the pre-holiday period (October 21 through November 21).
KPIs for eCommerce rose significantly during the holiday shopping season, including a whopping 41% increase in conversion rate.Falling checkout abandonment rates reaffirm that shoppers tended to begin browsing for items of interest before the holidays, and then make their purchase decisions after peak season promotions kicked off.
While the holiday shopping season gave a significant boost to eCommerce in general, online marketplaces benefited most of all—enjoying an increase of more than 100% in their conversion rates.
TOP VERTICALS BY CONVERSION RATE INCREASE
Electronics +84.81%
Footwear +32.78%
Marketplaces +104.81%
Gifts & Hobbies +66.67%
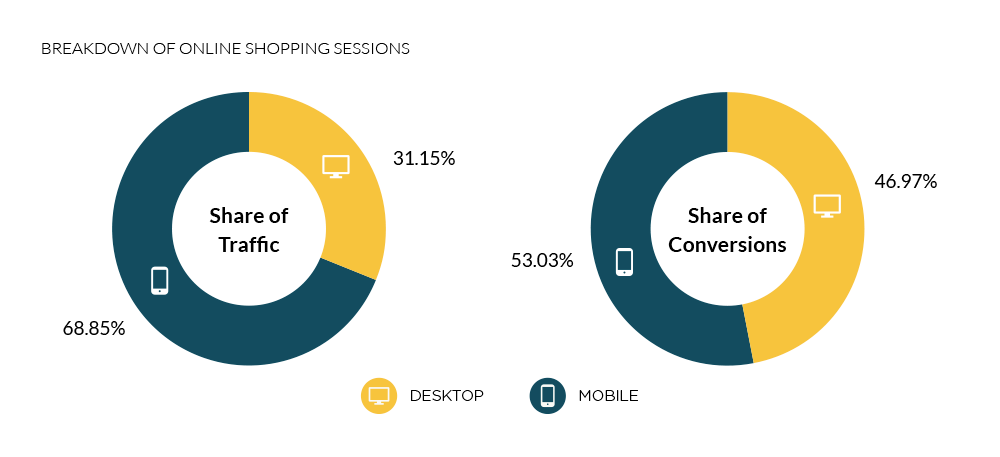
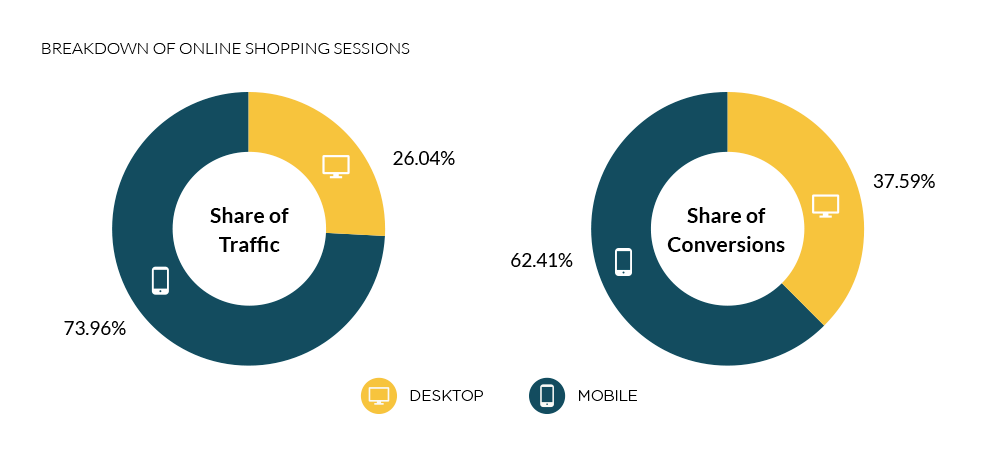
MOBILE IS THE NEW KING IN TOWN
In light of trends from previous years, it was no surprise that most mobile KPIs jumped more than desktop KPIs during the holiday shopping season. Total mobile conversions more than doubled during this peak period, while mobile devices saw more than two-thirds of all eCommerce traffic.

ut the big news was that more of the holiday shopping season’s purchases were made on mobile devices than on desktop computers. This stands in stark contrast to the 2018 holiday shopping season, when we found that mobile only accounted for only 34.39% of online purchases in the U.S.
Europe Data
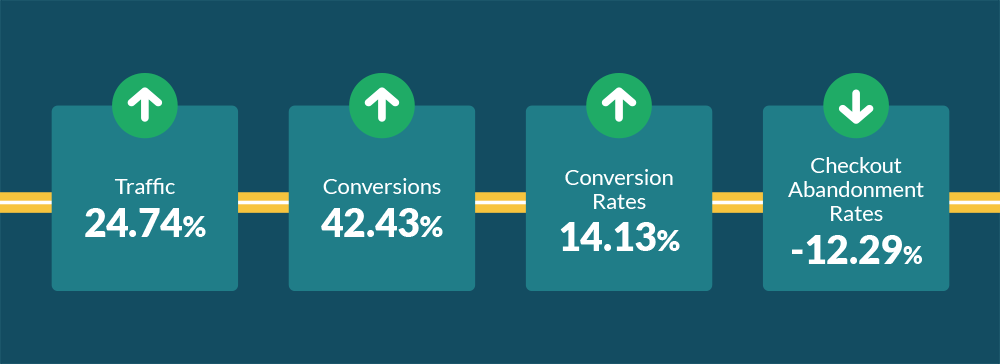
ECOMMERCE KPIs WERE STRONG
As in the U.S., cross-device metrics across the board in Europe were significantly higher during the holiday shopping season than during the pre-holiday period. KPIs rose markedly during the holiday shopping season. Although these numbers increased by less in Europe than in the U.S., the overall number of conversions in Europe was 42% higher during the holiday shopping season than during the pre-holiday period.
As these overall KPIs improved, electronics retailers benefited far more than any other vertical—followed by footwear retailers.
Electronics +74.68%
Footwear +51.53%
Home +19.17%
Apparel +17.6%
MOBILE OVERTOOK DESKTOP IN 2019
In Europe as in the U.S., mobile KPIs jumped more than desktop KPIs during the holiday shopping season. Total mobile conversions increased by nearly 50%, while mobile devices saw more than two-thirds of all eCommerce traffic.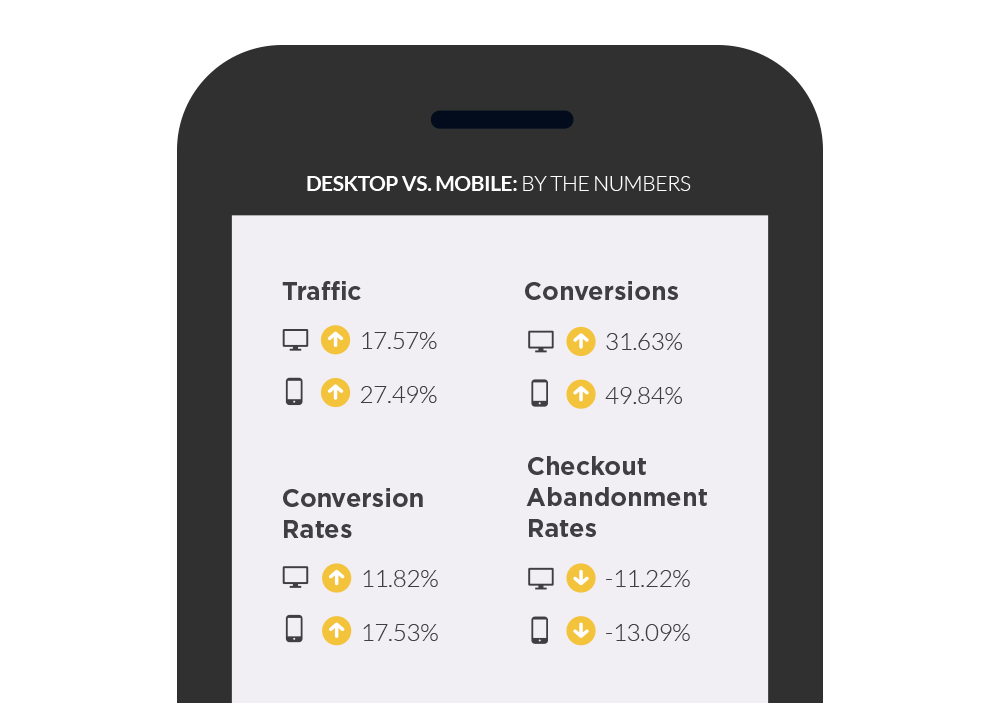
Also similarly to the U.S., Europe’s 2019 holiday shopping season was the first one in which more purchases were made from mobile devices than from desktop or laptop computers.
This represents a major shift from the previous year’s peak shopping period, in which we found that mobile devices accounted for only 30.52% of online purchases in Europe.
CUSTOMER JOURNEY HIJACKING
After all the time and money eCommerce companies invest in crafting the ideal online customer journey for their target audience, many of their shoppers receive a very different experience than what was intended.
That’s because 15-20% of all consumers visiting an eCommerce website are exposed to unauthorized ads injected to appear as if they are part of that website—a phenomenon that we call Customer Journey Hijacking (CJH).
These injected ads can include pop-ups, banners, and/or product ads. When the user clicks on a link, the malware may also redirect them to a different website—a tactic that is often used on unwitting shoppers. The majority of these injected ads (60% to 65%, according to data gathered by Namogoo) promote products sold by competing stores.
Namogoo monitors conversion rates year-round, both among “hijacked” consumers (site visitors impacted by unauthorized ad injections, which Namogoo blocks) and among “unaffected” consumers (site visitors not impacted by unauthorized ad injections).
CUSTOMER JOURNEY HIJACKING DURING THE HOLIDAY SHOPPING SEASON
During the 2019 holiday shopping season, nearly one out of every five visitor sessions was impacted by Customer Journey Hijacking. These rates were largely consistent throughout 2019, illustrating the importance of protecting the customer journey year-round.
CONVERSION RATES:
RECOVERED VS. UNAFFECTED VISITOR SESSIONS
In this peak shopping period, conversion rates for hijacked visitor web sessions recovered by Namogoo were 2.78 times higher than those of unaffected visitors in the U.S. and 2.72 times higher in Europe. That’s a pattern we see consistently, because the most engaged online shoppers are the most likely to download software bundled with ad injections.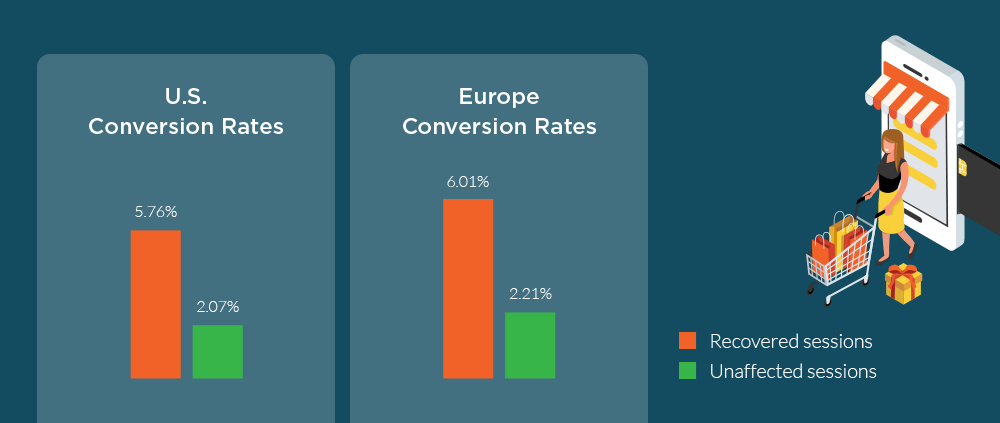
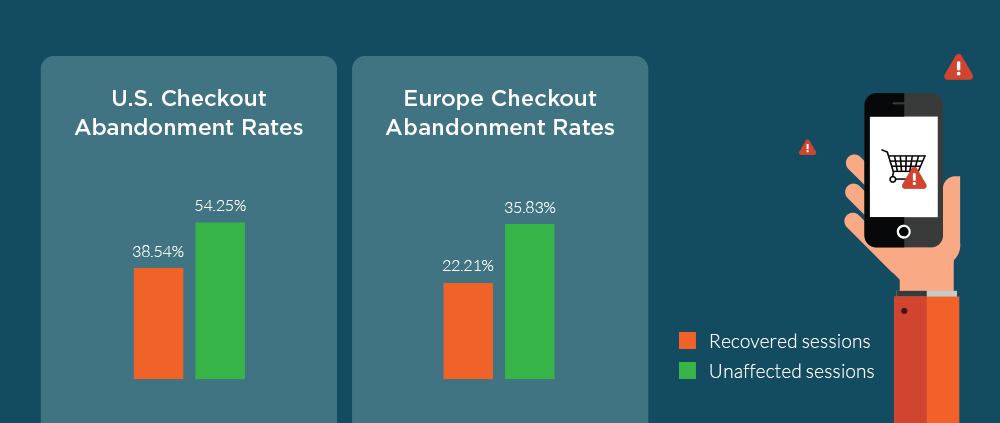
CHECKOUT ABANDONMENT:
RECOVERED VS. UNAFFECTED VISITOR SESSIONS
While checkout abandonment rates decreased across the board during the holiday shopping season, these rates dropped significantly lower amongst hijacked visitors protected against ad injections. This engaged segment abandoned their carts 29% less frequently than the rest of visitors in the U.S. and 38% less often in Europe.
SUMMARY
In this report, we at Namogoo aimed to gauge the impact of the holiday shopping season on eCommerce and to find out whether the peak sales period of 2019 was different from previous years. We were not surprised to see that KPIs improved significantly during the holiday shopping season, although it was notable how much sharper that jump was in the U.S. than in Europe. And it was particularly remarkable that online marketplaces in the U.S. saw their conversion rates more than double as compared to the pre-holiday period.
But perhaps the biggest news to come out of this report is that it seems that mobile devices have finally surpassed desktop and laptop computers as the tools of choice for making online purchases—at least in the U.S. and Europe during the holiday shopping season.
Our findings also showed that Customer Journey Hijacking remained active during the holiday shopping season, with injected ads appearing in more than 18% of eCommerce sessions in both the U.S. and Europe. And we see that injected ads showed up most often on the devices of particularly active online shoppers—as shown by the fact that “recovered” users for whom injected ads were blocked had conversion rates over 2.7 times higher than “unaffected” users.
As retailers turn their focus from the sales of 2019 to those of 2020, it’s worthwhile for them to keep in mind some of the key trends from this report. For anyone who has yet to recognize the importance of offering user experiences optimized for mobile devices, these numbers should be a clear wake-up call. And for retailers who already recognize the importance of offering an all-around excellent customer experience, this report’s findings show just how prevalent the disruptions of injected ads have become.