


About This Report
As the dust settles after the 2018 holiday shopping season, online retailers and eCommerce businesses will be diving deep into the results to measure just how effectively their online promotional campaigns capitalized on the opportunity — and translated increased traffic into more revenue and improved conversion rates.
Just what type of impact did the holiday season have on eCommerce brands in 2018? What days stood out amongst the pack when it came to traffic, orders, and conversion rates? Which verticals saw their KPIs rise the most?
To uncover top holiday season eCommerce insights, Namogoo analyzed hundreds of millions of web sessions across regions, devices, and verticals.
This report analyzes aggregate and anonymized consumer web session data. We summarize and compare findings that emerged during two main time periods:


Key Findings
- Holiday Season mobile eCommerce traffic rose by 46.99% in the U.S. and 50.54% in Europe respectively when compared to previous weeks, both increasing at a higher rate than desktop.
- Mobile orders increased by 93.68% in the U.S. during the Holiday Season, surpassing the 85.27% order uplift on desktops, and topping the European mobile order increase of 75.11%, which remained slightly behind that of desktop.
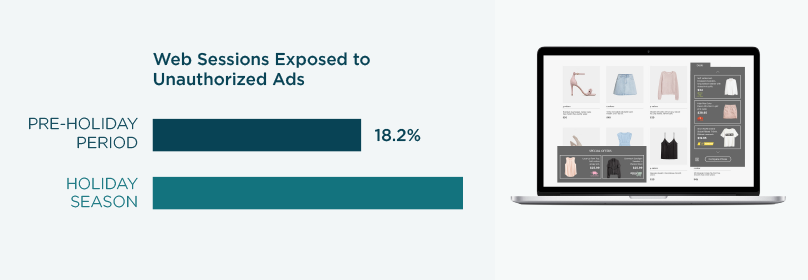
- 24.5% of all eCommerce site visits during the Holiday Season were exposed to unauthorized injected ads, a significant rise from the Pre-Holiday Period where 18.2% of all web sessions were disrupted by Customer Journey Hijacking.
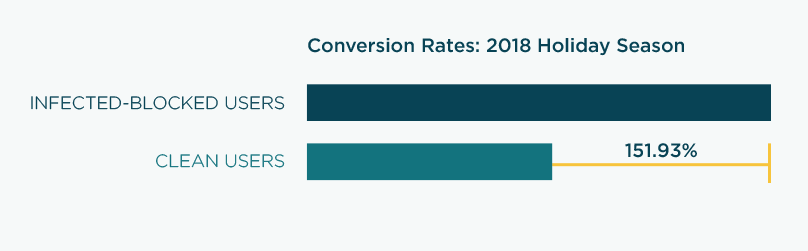
- Infected users who had injected ads blocked from interrupting their online experience converted 2.5 times higher than clean users during the Holiday Season.
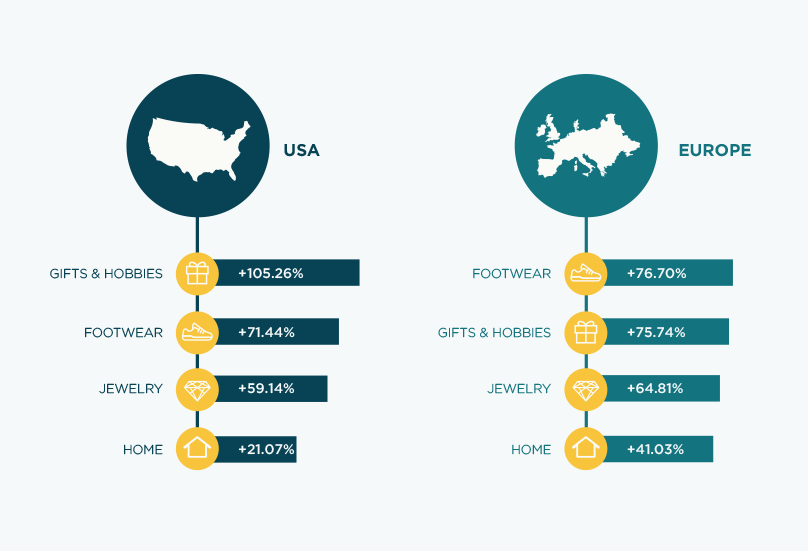
- Footwear retailers saw conversion rates jump by 71.44% in the U.S. and by 76.70% in Europe during the Holiday Season.
- Gifts & Hobbies experienced a 105.26% conversion rate spike in the U.S. and a 76.70% gain in Europe.
- Cyber Monday netted 15.50% more orders and a 9.11% higher average conversion rate than Black Friday in the U.S.
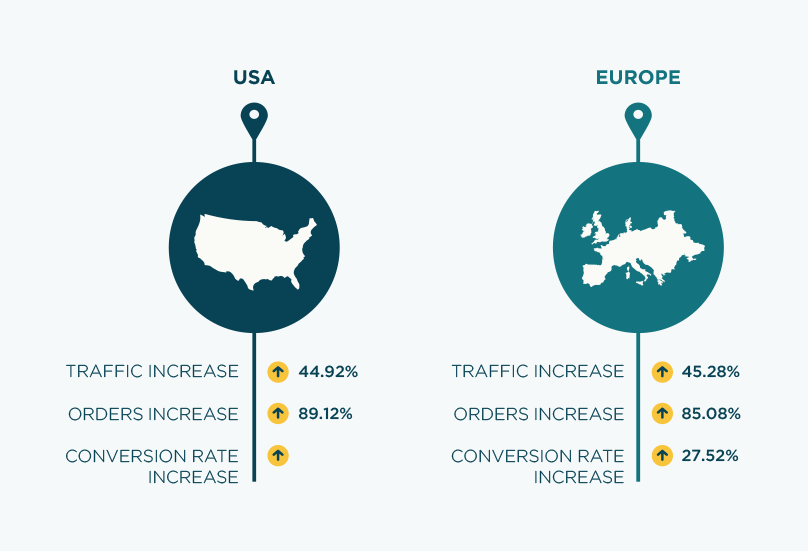
Overall Holiday Online Trends by Region
We compared cross-device traffic, orders, and conversion rates during the Holiday Season (Nov. 22 – Dec. 24) to those during the Pre-Holiday Period (Oct. 21 – Nov. 21).
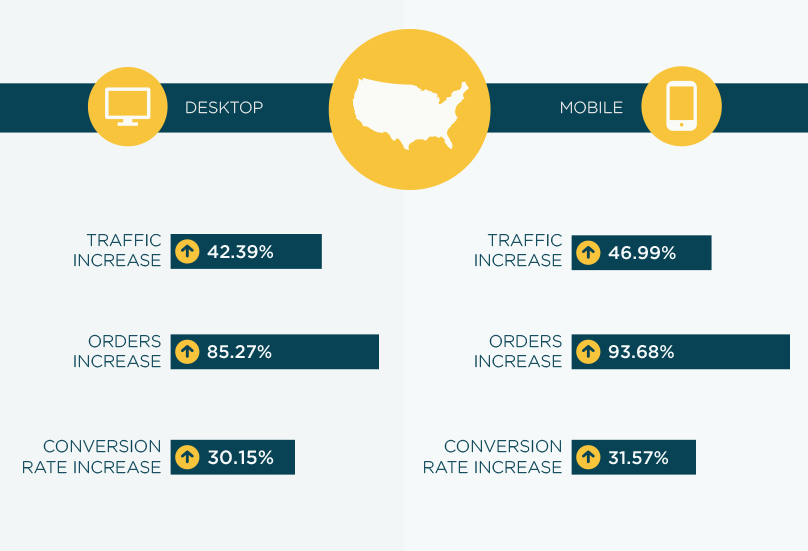
United States: Mobile & Desktop Trends
We analyzed mobile and desktop trends for traffic, orders, and conversion rates during the Holiday Season as compared to the Pre-Holiday Period.
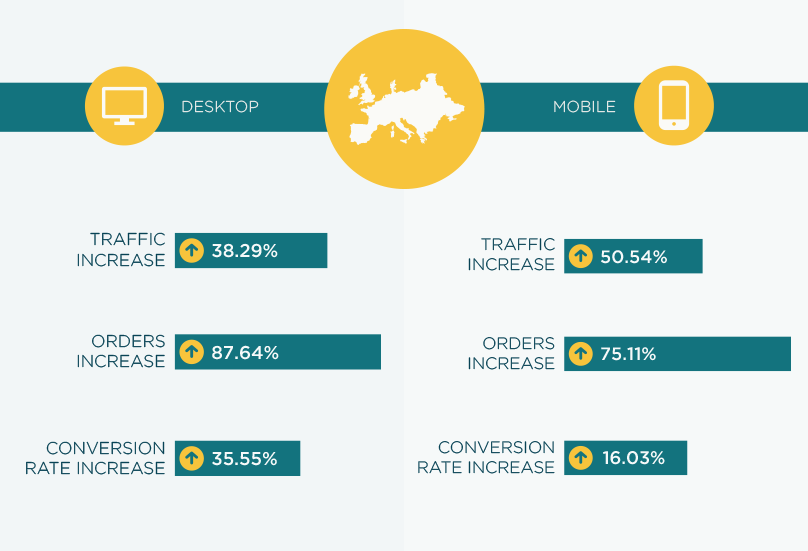
Europe: Mobile & Desktop Trends
We analyzed mobile and desktop trends for traffic, orders, and conversion rates during the Holiday Season as compared to the Pre-Holiday Period.
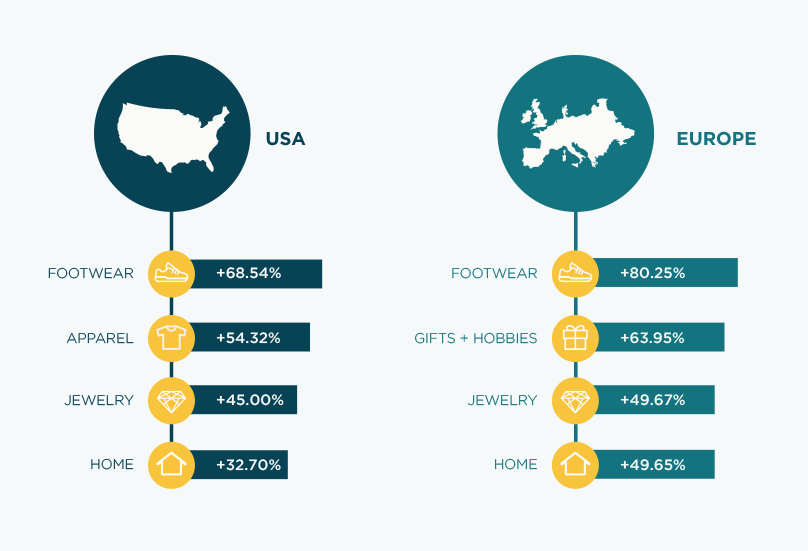
Top Verticals by Traffic Increase
These verticals experienced the largest cross-device increase in web traffic during the Holiday Season when compared to the Pre-Holiday Period.
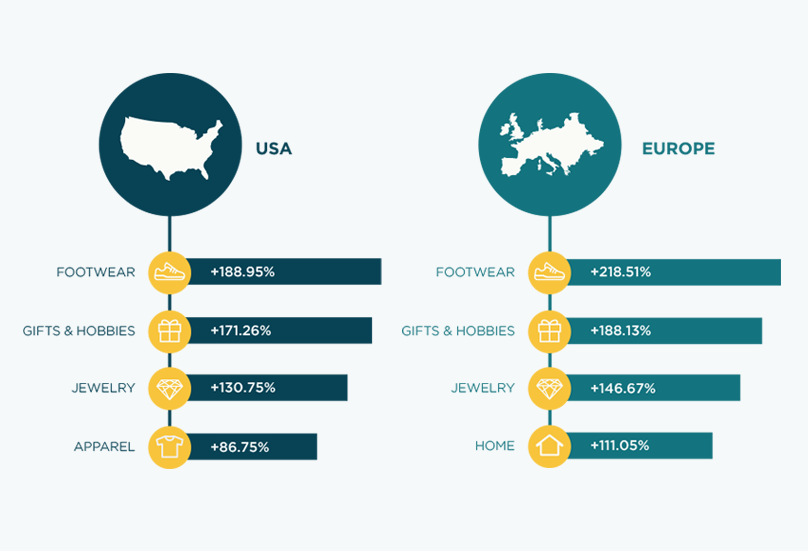
Top Verticals by Orders Increase
These verticals saw the largest cross-device uplift in orders during the Holiday Season when compared to the Pre-Holiday Period.
Top Verticals by Conversion Rate Increase
These verticals enjoyed the largest cross-device boost in conversion rates during the Holiday Season when compared to the Pre-Holiday Period.
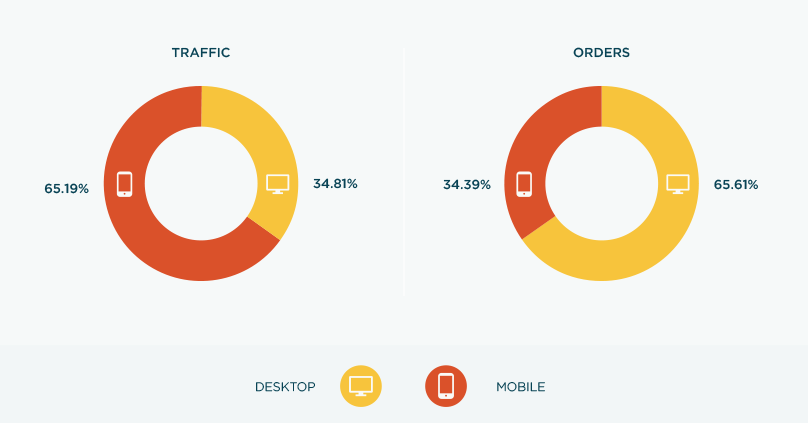
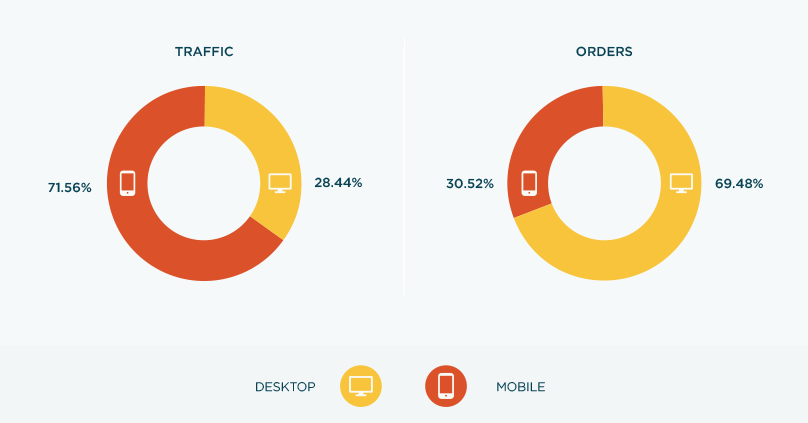
United States: Mobile vs. Desktop Split
While web traffic was significantly higher on mobile than on desktop in the U.S. during the Holiday Season, the majority of consumers still made their purchases on desktops.
Europe: Mobile vs. Desktop Split
In Europe, the difference between traffic and orders was even more pronounced: A vast majority of site visits took place on mobile, while desktop orders surpassed mobile orders by an even greater margin than in the U.S.
Customer Journey Hijacking: Infection Rates Rise During the Holiday Season
Customer Journey Hijacking is a growing problem where unauthorized product ads, pop-ups, and banners that are injected into consumer browsers disrupt online visitors and divert them to competitor sites, harming eCommerce conversion rates and revenue. An infection rate is the percentage of visitors to a website that are exposed to these unsanctioned ads during their session. Below is an example of an infected user’s experience when exposed to Customer Journey Hijacking.
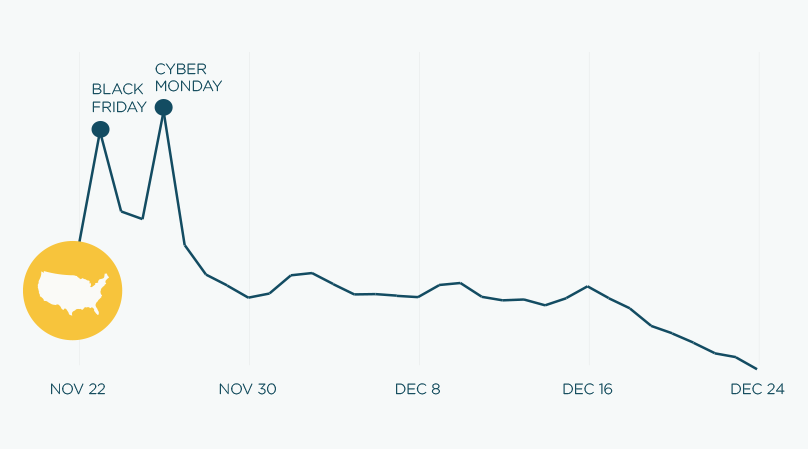
United States: Holiday Traffic Patterns
As was expected, eCommerce traffic was at its peak during the Cyber Weekend covering Black Friday to Cyber Monday. From Nov. 29, web traffic settled, hovering just above and below the Holiday Season average, before consistently declining from Dec. 16 all the way through to Christmas Eve.
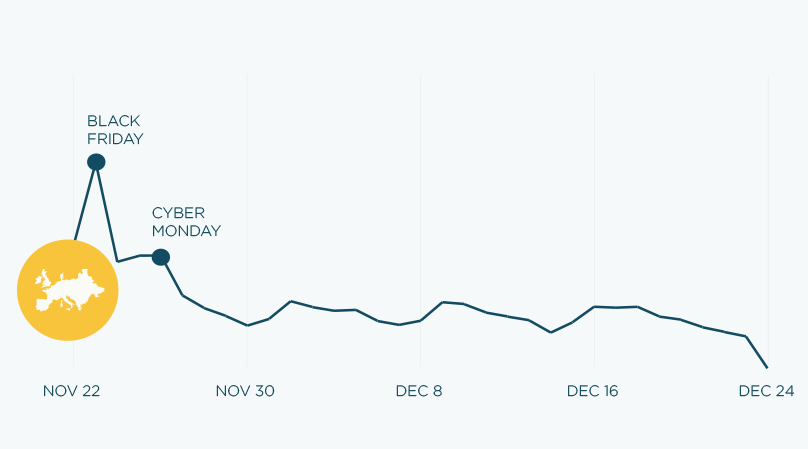
Europe: Holiday Traffic Patterns
The period covering Cyber Weekend largely registered the highest traffic volumes in Europe. While Black Friday attracted the most number of site visits, the previous day was the second-highest day for traffic. Following Cyber Weekend, traffic fluctuated just below and above the Holiday Season average before declining after Dec. 21.
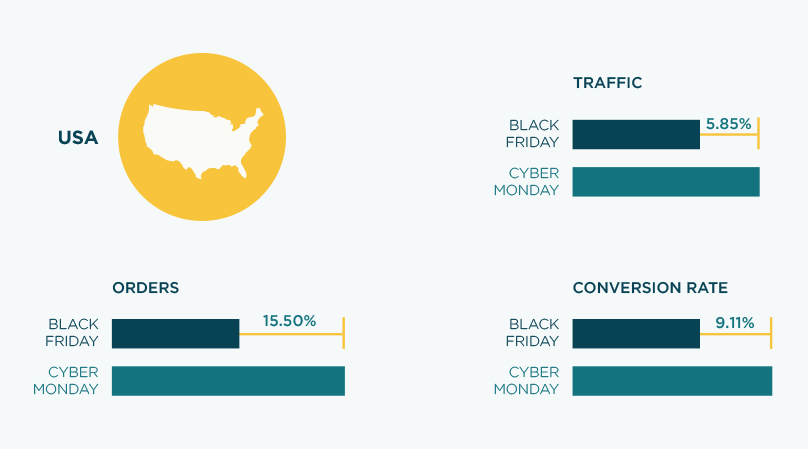
United States: Black Friday vs. Cyber Monday
Cyber Monday outperformed Black Friday in 2018, netting 5.85% more traffic, 15.50% more orders, and perhaps most notably, registering a 9.11% higher conversion rate. Black Friday still recorded the second-highest totals for traffic and orders as well as for conversion rates.
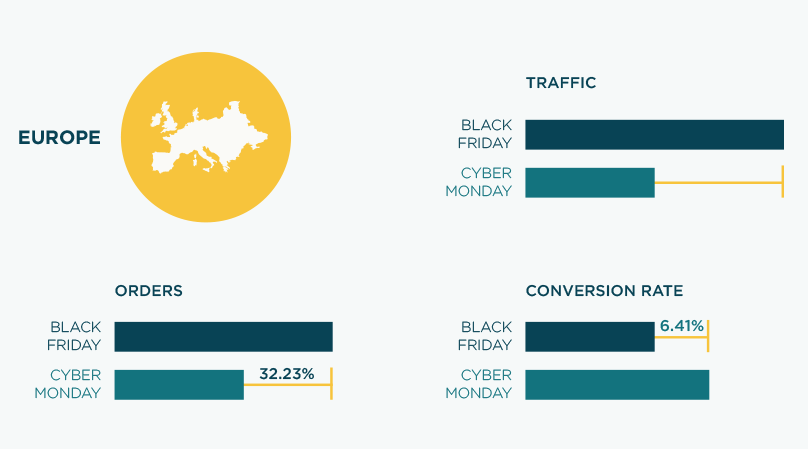
Europe: Black Friday vs. Cyber Monday
In contrast to the U.S., more consumers visited and made purchases on eCommerce sites on Black Friday then on Cyber Monday. However, Cyber Monday recorded a higher average conversion rate, topping Black Friday’s by 6.41%.
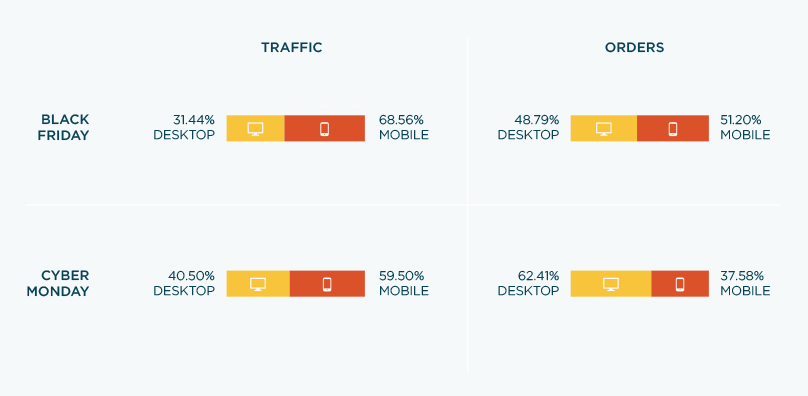
United States: Mobile vs. Desktop Splits for Black Friday & Cyber Monday
More users browsed for products using their mobile devices on both Black Friday and Cyber Monday. Mobile purchases actually edged out desktop purchases on Black Friday, while a majority of users still opted for their desktop when completing their orders on Cyber Monday.
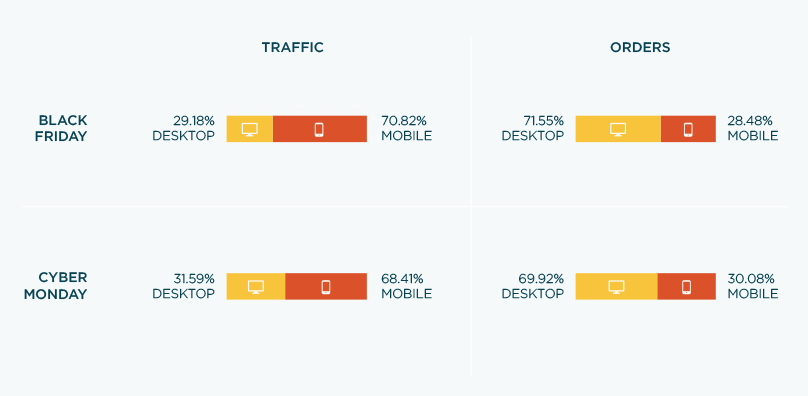
Europe: Mobile vs. Desktop Splits for Black Friday & Cyber Monday
In Europe, an even greater majority of shoppers browsed for products on mobile on both Black Friday and Cyber Monday. Unlike the U.S. findings, most online orders took place on desktop during both of the Holiday Season’s top shopping days.
How Do Infected Users Convert With Invasive Ads Removed from Their Journey?
Namogoo monitors conversion rates for clean users and infected-blocked users year-round. In line with trending data throughout the year, infected-blocked users registered a conversion rate that is 2.5x higher than that of clean users during the Holiday Season. This demonstrates the importance of the infected user segment to online business revenue.
What is an infected-blocked user?
These users were previously impacted by Customer Journey Hijacking and exposed to unauthorized injected ads when visiting eCommerce sites, and have had these disruptions blocked to provide them with a distraction-free experience.
What is a clean user?
Clean users are not impacted by Customer Journey Hijacking, and therefore not exposed to malware-driven ad injections during their web session.